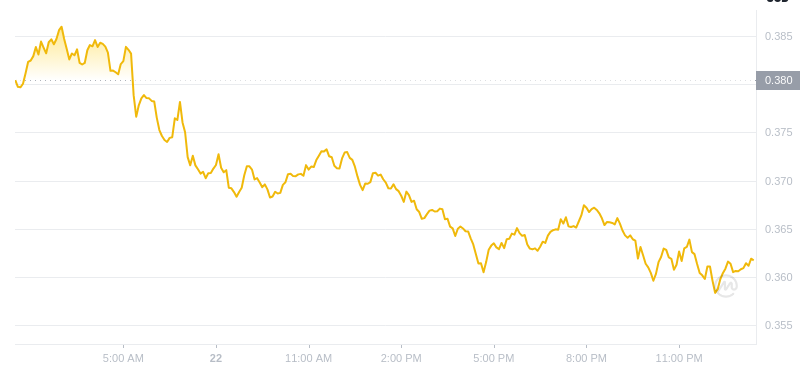
Dogecoin Price Correction After Post-Election Surge
선거 후 급증 후 Dogecoin 가격 조정
Dogecoin (DOGE), the prominent meme coin, experienced a technical correction, dipping to $0.1930 on November 7. This 12% decline followed a multi-month high reached on November 6 in the wake of Donald Trump's election victory.
유명한 밈 코인인 Dogecoin(DOGE)은 11월 7일에 0.1930달러로 하락하는 기술적 조정을 경험했습니다. 이 12% 하락은 도널드 트럼프의 선거 승리 이후 11월 6일에 도달한 수개월 최고치에 이어 발생했습니다.
Despite the correction, DOGE has demonstrated strong performance in recent days, surging by 140% since its August low. Trader optimism surrounding Trump's victory and its potential implications for Elon Musk, DOGE's prominent supporter, contributed to these gains. Musk is anticipated to play a role in the Department of Government Efficiency and advocate for cryptocurrency within the administration.
조정에도 불구하고 DOGE는 최근 며칠간 강력한 실적을 보여 8월 최저치 이후 140%나 급등했습니다. 트럼프의 승리와 그것이 DOGE의 저명한 지지자인 Elon Musk에 대한 잠재적인 영향을 둘러싼 트레이더의 낙관론이 이러한 이익에 기여했습니다. 머스크는 정부 효율성부에서 역할을 수행하고 행정부 내에서 암호화폐를 옹호할 것으로 예상됩니다.
Fundamentals and Technical Indicators Support Long-Term Growth
장기적인 성장을 지원하는 기본 및 기술 지표
Dogecoin exhibits robust fundamentals and technical indicators suggesting potential for long-term appreciation. Futures open interest has reached its highest point since April, currently standing at $1.62 billion. Additionally, spot market volume has sustained an elevated level, reaching $6.4 billion on Thursday, indicating active buying interest.
Dogecoin은 장기적인 평가 가능성을 시사하는 강력한 기본 및 기술 지표를 보여줍니다. 선물 미결제약정은 현재 16억 2천만 달러로 4월 이후 최고치를 기록했습니다. 또한 현물 시장 거래량은 목요일에 64억 달러에 달하는 높은 수준을 유지하여 적극적인 매수 관심을 나타냈습니다.
Bullish Chart Patterns Suggest Upside Potential
강세 차트 패턴은 상승 잠재력을 암시합니다
On the daily chart, DOGE has formed a falling wedge pattern, with two trendlines connecting higher lows and lower lows. A bullish breakout occurs as the lines approach each other. Additionally, a golden cross pattern emerged on October 25, where the 200 and 50-day moving averages crossed bullishly, often signaling further gains.
일일 차트에서 DOGE는 더 높은 저점과 더 낮은 저점을 연결하는 두 개의 추세선이 있는 하락 쐐기 패턴을 형성했습니다. 선이 서로 접근함에 따라 강세 돌파가 발생합니다. 또한 10월 25일에는 200일 이동평균선과 50일 이동평균선이 강세로 교차하는 골든 크로스 패턴이 나타나 종종 추가 상승을 예고했습니다.
DOGE is currently in the process of forming a cup and handle pattern, typically indicating continued growth. Breaking above the cup's upper lip at $0.2285 would validate further upward momentum.
DOGE는 현재 지속적인 성장을 나타내는 컵 앤 핸들 패턴을 형성하는 과정에 있습니다. $0.2285에서 컵 윗입술을 돌파하면 추가 상승 모멘텀이 입증될 것입니다.
However, a drop below $0.1425, the November 3 swing low, would invalidate the bullish outlook.
그러나 11월 3일 최저치인 $0.1425 아래로 떨어지면 강세 전망이 무효화됩니다.


 Thecryptoupdates
 Crypto Intelligence
 Crypto News Land
 Crypto Intelligence
 Optimisus
 DogeHome
 CaptainAltcoin
 CoinsProbe
 Crypto Daily™


