DOGE, a leading meme coin in the digital currency space, has recently witnessed a significant surge in its value. This upward trend was short-lived, as Dogecoin price now exhibits a horizontal trading pattern. This behavior indicates a consolidation period, suggesting a pause after its rapid rise.
디지털 통화 분야의 선도적인 밈 코인인 DOGE는 최근 그 가치가 크게 상승하는 것을 목격했습니다. Dogecoin 가격이 이제 수평적인 거래 패턴을 보이기 때문에 이러한 상승 추세는 단명했습니다. 이 동작은 통합 기간을 나타내며 급격한 상승 후 일시 중지를 나타냅니다.
Over the past 24 hours, Dogecoin price has significantly decreased, down by 4.95% to $0.1870. This downturn comes amidst a broader slump in the market, as reflected by Dogecoin’s market capitalization, which also fell by 4.90% to $27.6 billion.
지난 24시간 동안 Dogecoin 가격은 4.95% 하락한 $0.1870으로 크게 하락했습니다. 이러한 침체는 Dogecoin의 시가총액이 4.90% 감소한 276억 달러로 반영된 것처럼 시장의 광범위한 침체 중에 발생합니다.

The trading volume has surged by 28.13% to $1.79 billion, indicating a spike in trading activity. Despite the recent decline, Dogecoin remains a popular digital asset, occupying the 8th rank by market capitalization among cryptocurrencies.
Dogecoin 가격거래량은 28.13% 증가한 17억 9천만 달러로 거래 활동이 급증했음을 나타냅니다. 최근 하락세에도 불구하고 Dogecoin은 암호화폐 중 시가총액 기준 8위를 차지하며 인기 있는 디지털 자산으로 남아 있습니다.
Meanwhile, the 24 hour price movement chart shows a volatile market, with Dogecoin experiencing sharp swings, hitting a low of $0.1915, further indicating the unpredictable nature of the crypto markets.
한편, 24시간 가격 변동 차트는 Dogecoin이 급격한 변동을 경험하여 최저치인 0.1915달러를 기록하는 등 변동성이 큰 시장을 보여주며 이는 암호화폐 시장의 예측할 수 없는 특성을 더욱 나타냅니다.
Dogecoin Price Forecast: What’s Next for the Leading Meme Currency?
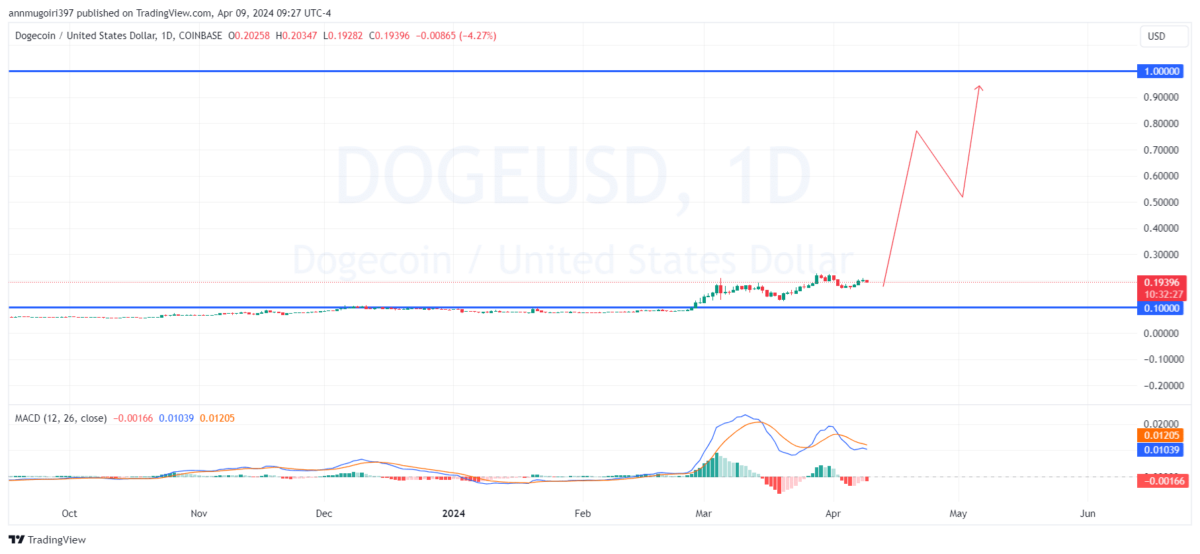
DOGE has been trading in a tight range near the $0.20 mark, a significant psychological barrier it crossed three weeks prior. On the last day, the price dipped below $0.2, suggesting a possible downward movement. Still, the outlook remains positive for many in the market, reflecting a broader optimistic view on cryptocurrencies.
Dogecoin 가격 예측: 선도적인 Meme 통화의 다음 단계는 무엇입니까? DOGE는 3주 전에 넘어섰던 상당한 심리적 장벽인 $0.20 근처의 좁은 범위에서 거래되고 있습니다. 마지막 날 가격은 0.2달러 아래로 하락해 하향 움직임이 있음을 시사했습니다. 그럼에도 불구하고 암호화폐에 대한 보다 폭넓은 낙관적 견해를 반영하여 시장의 많은 사람들에게 전망은 여전히 긍정적입니다.
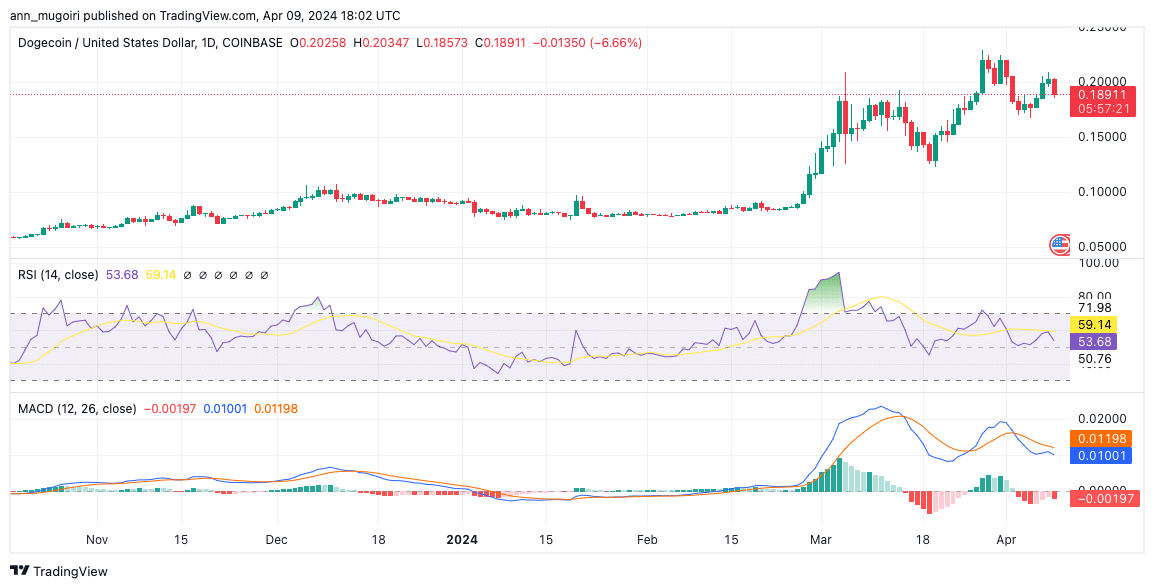
Dogecoin’s recent price action shows oscillations between $0.21 and $0.16, indicating a 2% increase. Over the last month, its value has risen by 7%, a notable achievement despite the mixed market signals of bullishness and bearishness, making a strong momentum elusive.
Dogecoin의 최근 가격 조치는 $0.21에서 $0.16 사이의 변동을 보여 2% 증가를 나타냅니다. 지난 한 달 동안 그 가치는 7% 상승했는데, 이는 강세와 약세라는 혼합된 시장 신호에도 불구하고 주목할만한 성과로 강력한 모멘텀을 찾기 어렵습니다.
Data from Coinglass reveals a 5.04% decrease in DOGE’s derivatives volume, which has fallen to $3.97 billion. Additionally, there’s been a 1.44% drop in open interest, now at $1.66 billion. This points to a declining market interest for DOGE, with the OI-weighted funding rate decreasing to 0.0347%, highlighting a growing bearish market sentiment.
Coinglass의 데이터에 따르면 DOGE의 파생상품 거래량이 5.04% 감소하여 39억 7천만 달러로 감소했습니다. 또한 미결제약정은 1.44% 감소하여 현재 16억 6천만 달러에 이르렀습니다. 이는 DOGE에 대한 시장 관심이 감소하고 OI 가중 펀딩 비율이 0.0347%로 감소하여 약세 시장 정서가 커지고 있음을 나타냅니다.
Is Dogecoin Poised for a Breakout or a Breakdown?
If bearish pressure intensifies, Dogecoin might fall below $0.18, possibly reaching a $0.15 support level, signaling a market trend shift to bearish. Conversely, a bullish resurgence could propel the price back to $0.2 and potentially towards the $1 landmark. Achieving such a milestone depends on Dogecoin overcoming significant resistance levels and maintaining momentum.
Dogecoin은 돌파 또는 붕괴에 대비하고 있습니까? 약세 압력이 강화되면 Dogecoin은 $0.18 아래로 떨어져 $0.15 지원 수준에 도달할 수 있으며 이는 시장 추세가 약세로 전환된다는 신호입니다. 반대로, 강세를 보이는 부활은 가격을 0.2달러로 되돌리고 잠재적으로 1달러 랜드마크를 향해 나아갈 수 있습니다. 이러한 이정표를 달성하는 것은 Dogecoin이 상당한 저항 수준을 극복하고 추진력을 유지하는 데 달려 있습니다.

The Relative Strength Index (RSI), sitting at 53.68, implies a market in balance, neither dominated by buyers nor sellers. Meanwhile, the Moving Average Convergence Divergence (MACD) signals a potential shift toward bullish momentum, as evidenced by the MACD line’s recent ascent above the signal line.
도지코인 가격| 출처: Tradingview상대강도지수(RSI)는 53.68로 구매자도 판매자도 지배하지 않는 균형 잡힌 시장을 의미합니다. 한편, MACD(이동 평균 수렴 발산)는 최근 MACD 선이 신호 선 위로 상승한 것으로 입증되는 것처럼 강세 모멘텀으로의 잠재적 이동을 나타냅니다.


 Crypto Daily™
 BlockchainReporter
 Crypto Daily™
 Crypto Daily™
 crypto.news
 CoinPedia News
 Cryptopolitan_News
 Crypto Daily™
 BSCN
BSCN


