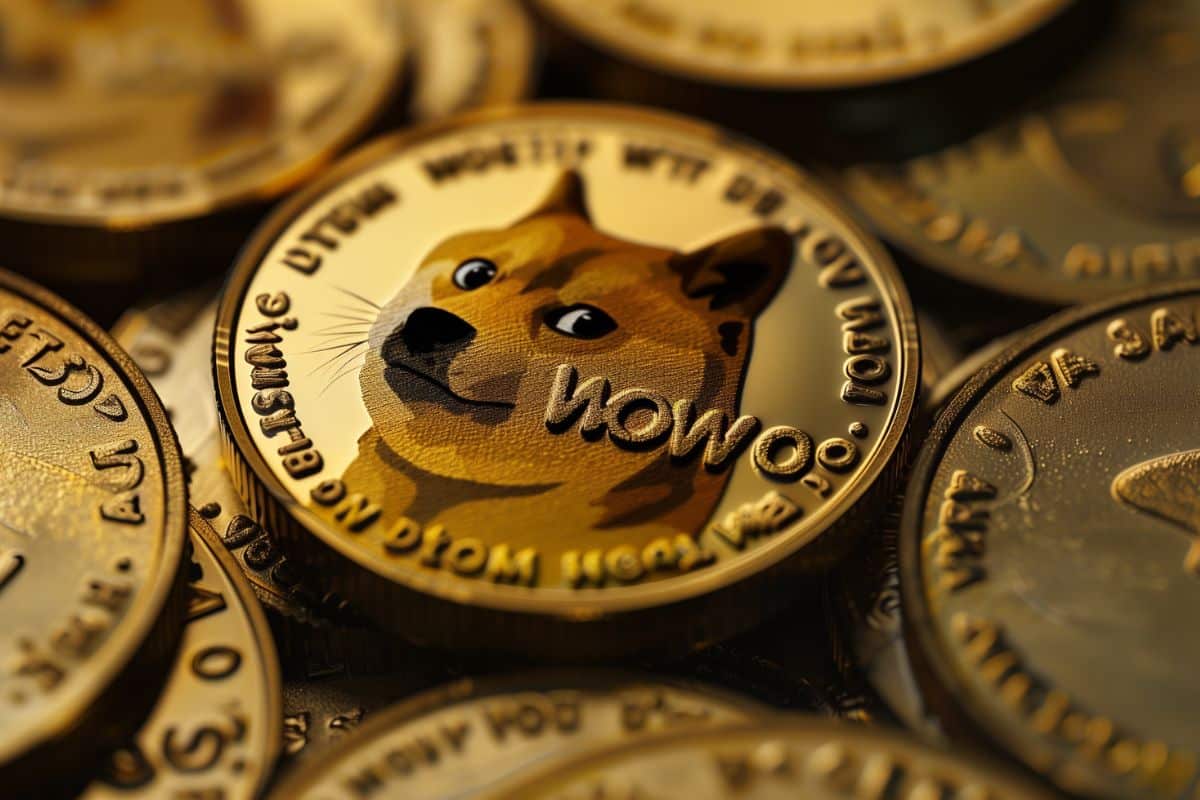
Dogecoin Surges 7% Amidst Musk's Tweet and Technical Uptrend
도지코인, 머스크 트윗과 기술적 상승세 속에 7% 급등
In the past 24 hours, the price of Dogecoin has climbed by 7%, reaching $0.1247 as of 00:18 a.m. EST, with a skyrocketing trading volume of $2.28 billion, a 70% increase.
지난 24시간 동안 Dogecoin의 가격은 7% 상승하여 동부 표준시 오전 0시 18분 현재 0.1247달러에 도달했으며, 거래량은 70% 증가한 22억 8천만 달러로 급증했습니다.
This upward trend follows Elon Musk's tweet, which stated "D.O.G.E will fix it," in response to a Los Angeles Times article about California officials blocking SpaceX's rocket launches from the state.
이러한 상승 추세는 주에서 SpaceX의 로켓 발사를 막는 캘리포니아 공무원에 대한 Los Angeles Times 기사에 대한 응답으로 "D.O.G.E가 문제를 해결할 것입니다"라고 언급한 Elon Musk의 트윗에 따른 것입니다.
Bullish Technical Indicators
강세 기술 지표
The DOGE/USD chart suggests a bullish phase for Dogecoin, characterized by the breakout from the inverse head and shoulders pattern. This pattern typically indicates a trend reversal from bearish to bullish, with a breakout occurring at $0.112 along the neckline.
DOGE/USD 차트는 역헤드앤숄더 패턴의 돌파를 특징으로 하는 Dogecoin의 강세 국면을 제시합니다. 이 패턴은 일반적으로 약세에서 강세로의 추세 반전을 나타내며 네크라인을 따라 $0.112에서 돌파가 발생합니다.
The subsequent parabolic surge pushed Dogecoin's price above both the 50-day and 200-day Simple Moving Averages (SMAs), signifying strong bullish momentum.
이후의 포물선 급등으로 인해 Dogecoin의 가격은 50일 및 200일 단순 이동 평균(SMA) 이상으로 상승하여 강력한 강세 모멘텀을 나타냈습니다.
Overbought Territory Signals Potential Correction
과매수 영역은 잠재적인 조정 신호를 나타냄
The Relative Strength Index (RSI) value of 70.64 indicates intense buying pressure and overbought territory (above 70). This suggests that the price may be overextended in the short term, potentially leading to a pullback or consolidation period.
상대강도지수(RSI) 값 70.64는 강한 매수 압력과 과매수 영역(70 이상)을 나타냅니다. 이는 가격이 단기적으로 과도하게 확장되어 잠재적으로 하락세 또는 통합 기간으로 이어질 수 있음을 의미합니다.
The MACD line, which is above the signal line, exhibits a bullish crossover, while the histogram is positive but narrowing. This indicates that momentum remains strong but may start to slow down, aligning with the overbought RSI.
신호선 위에 있는 MACD 선은 강세 교차를 보이는 반면, 히스토그램은 양수이지만 좁아지고 있습니다. 이는 모멘텀이 여전히 강하지만 과매수 RSI에 맞춰 둔화되기 시작할 수 있음을 나타냅니다.
Dogecoin Price Prediction
Dogecoin 가격 예측
The Dogecoin price analysis suggests a sustained bullish rally, supported by the aforementioned technical indicators. If the momentum continues, Dogecoin could potentially reach the next resistance level at $0.14.
Dogecoin 가격 분석은 앞서 언급한 기술 지표에 의해 뒷받침되는 지속적인 강세 랠리를 시사합니다. 추진력이 계속된다면 Dogecoin은 잠재적으로 $0.14의 다음 저항 수준에 도달할 수 있습니다.
Should the bulls lose control due to the asset's overvaluation, Dogecoin may experience a correction back to the $0.1127 support (50-day SMA).
자산의 과대평가로 인해 상승세가 통제력을 잃을 경우 Dogecoin은 $0.1127 지원(50일 SMA)으로 다시 조정될 수 있습니다.


 DogeHome
 Cryptopolitan_News
 Coin Edition
 BlockchainReporter
 crypto.news
 Crypto Daily™
 BlockchainReporter
 Optimisus


