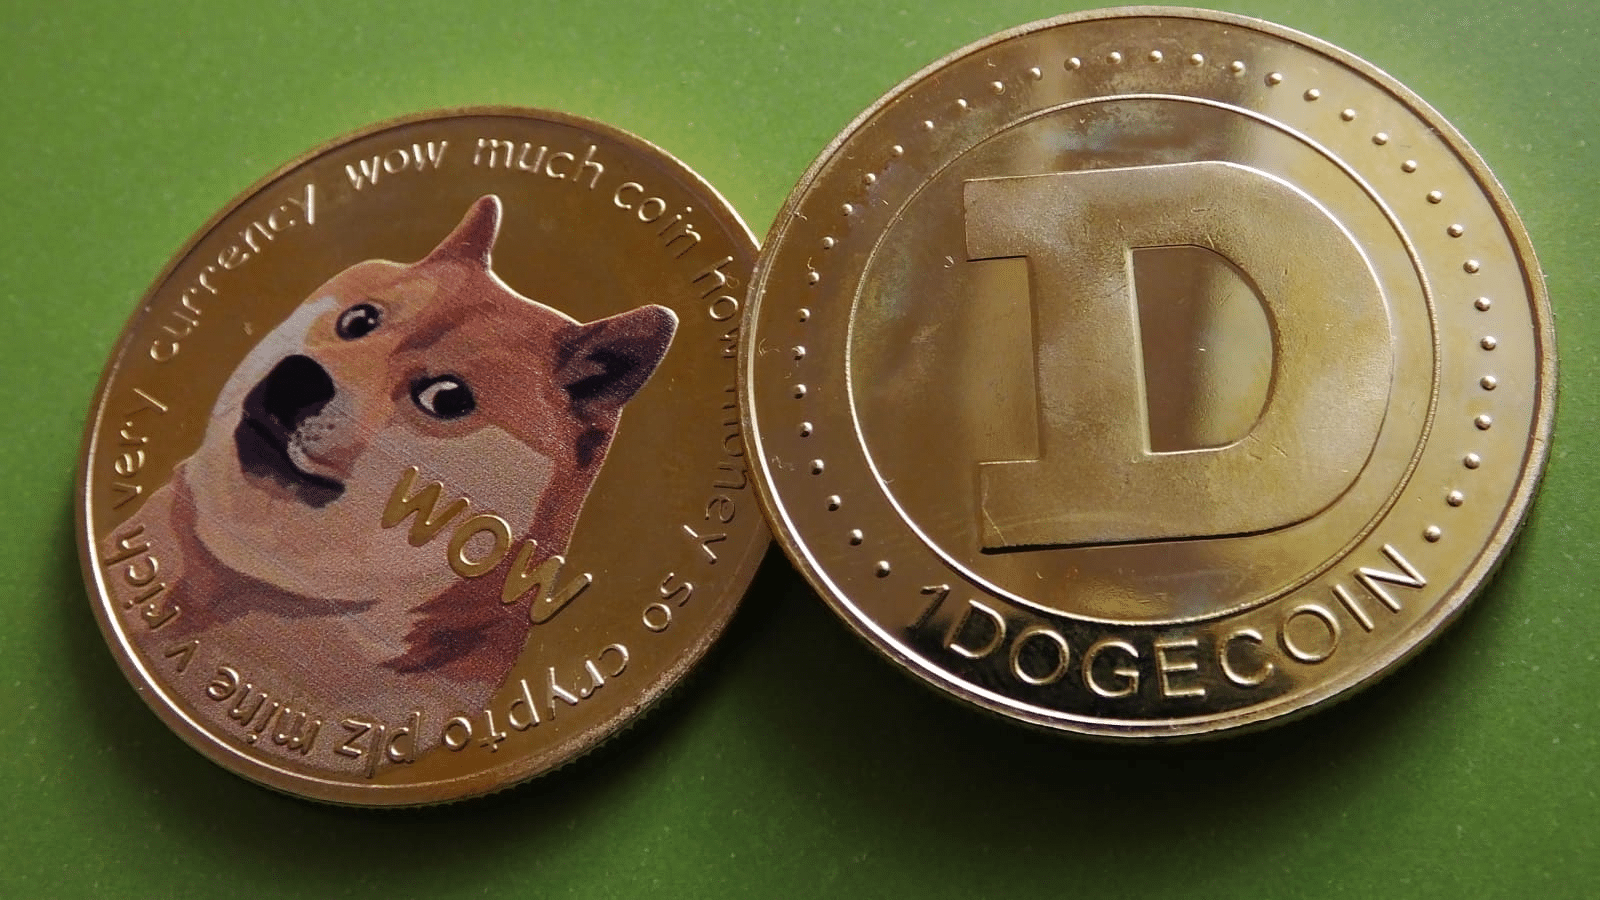
Dogecoin Price Surges, Targets Bullish Continuation
Dogecoin 가격 급등, 강세 지속 목표
The Dogecoin (DOGE) price has experienced a significant 13% surge in the past 24 hours, reaching $0.3793 as of 9:05 p.m. EST. Trading volume has also spiked by 94% to $5.8 billion.
Dogecoin(DOGE) 가격은 지난 24시간 동안 13% 급등하여 오후 9시 5분 현재 0.3793달러에 도달했습니다. EST. 거래량도 94% 증가한 58억 달러를 기록했습니다.
Technical Analysis
기술적 분석
The 4-hour chart analysis indicates a breakout from a consolidation phase, signaling renewed bullish sentiment. DOGE has decisively breached a rectangular range between $0.30 (support) and $0.34 (resistance).
4시간 차트 분석은 통합 단계의 돌파를 나타내며 새로운 강세 심리를 나타냅니다. DOGE는 $0.30(지지)와 $0.34(저항) 사이의 직사각형 범위를 결정적으로 돌파했습니다.
The price has also moved above the 50-day Simple Moving Average (SMA) of $0.3261 and is now approaching the 200-day SMA of $0.3723. A convincing breach of this critical resistance level could confirm a trend reversal.
가격은 또한 50일 단순 이동 평균(SMA) $0.3261을 넘어 현재 200일 SMA $0.3723에 접근하고 있습니다. 이 중요한 저항 수준을 확실히 돌파하면 추세 반전이 확인될 수 있습니다.
The Relative Strength Index (RSI) suggests strong upward momentum but also indicates an overbought condition. This implies a potential short-term correction or consolidation before a further rally.
상대강도지수(RSI)는 강력한 상승 모멘텀을 시사하지만 과매수 상태를 나타냅니다. 이는 추가 랠리가 발생하기 전에 잠재적인 단기 조정 또는 통합이 가능함을 의미합니다.
The Moving Average Convergence Divergence (MACD) histogram is positive, with the MACD line above the signal line, indicating bullish momentum. The widening gap between the lines suggests increasing strength in the upward move.
이동 평균 수렴 발산(MACD) 히스토그램은 양수이며 MACD 선이 신호 선 위에 있어 강세 모멘텀을 나타냅니다. 선 사이의 간격이 넓어지는 것은 상승세의 강도가 증가함을 나타냅니다.
Dogecoin Price Prediction
Dogecoin 가격 예측
The breakout and technical indicators suggest that DOGE is poised for further upside in the short term. If it holds above $0.3723, it could target resistance levels at $0.4000 and $0.4200.
돌파 및 기술 지표는 DOGE가 단기적으로 추가 상승할 준비가 되어 있음을 시사합니다. $0.3723 이상을 유지한다면 $0.4000와 $0.4200의 저항 수준을 목표로 할 수 있습니다.
However, the overbought RSI warrants caution. A pullback or consolidation towards the breakout level of $0.3500–$0.3600 is possible before the next leg higher.
그러나 과매수 RSI는 주의가 필요합니다. 다음 구간이 상승하기 전에 $0.3500~$0.3600의 돌파 수준을 향한 하락 또는 통합이 가능합니다.
On the downside, a failure to hold above $0.3723 may result in a revisit of support near $0.3261.
단점은 $0.3723 이상을 유지하지 못하면 $0.3261 근처에서 지지가 재방문할 수 있다는 것입니다.


 CryptoPotato_News
 crypto.news
 DogeHome
 TheCoinrise Media
 Crypto News Land
 TheCoinrise Media
 TheCoinrise Media
 Crypto News Land


