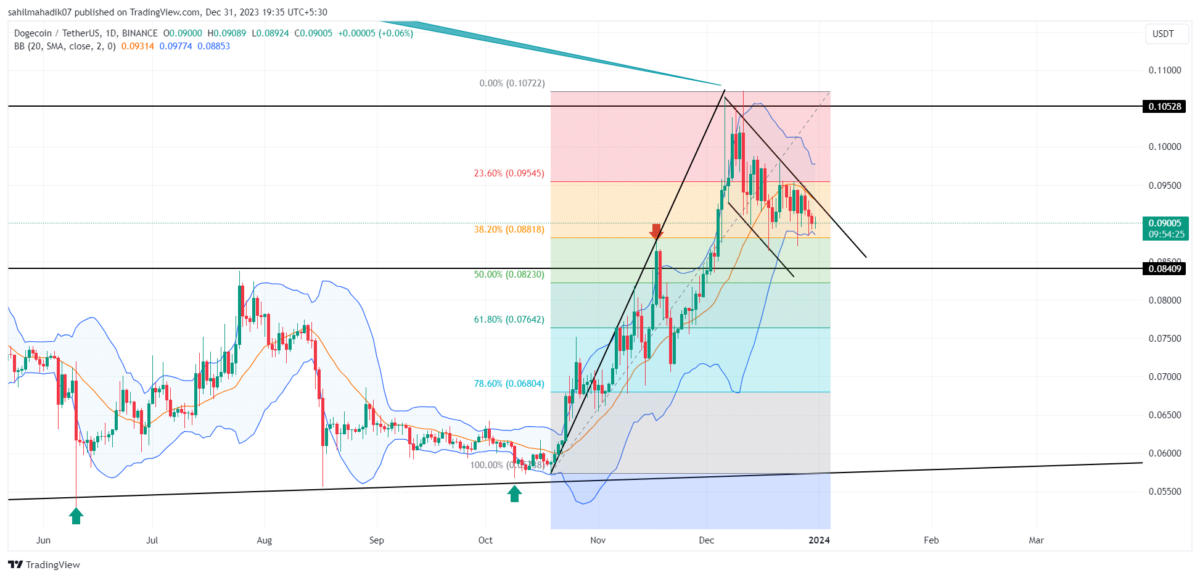
Dogecoin Price Prediction: Amid the current correction trend in the broader market, Dogecoin (DOGE) witnessed a notable correction from $0.107 resistance initiated in mid-December. This pullback plunged the coin price $0.09 down to the A Healthy retracement as per the Fibonacci retracement level indicating a significant possibility for uptrend continuation.
Dogecoin 가격 예측: 현재 광범위한 시장의 조정 추세 속에서 Dogecoin(DOGE)은 12월 중순에 시작된 $0.107 저항에서 주목할만한 조정을 목격했습니다. 이번 하락으로 인해 코인 가격이 $0.09 하락하여 상승 추세가 지속될 가능성이 있음을 나타내는 피보나치 되돌림 수준에 따른 A 건강한 되돌림까지 떨어졌습니다.
Also Read: Tesla Shifts Gear in 2024: Will it Have a Ripple Effect on Dogecoin?
또한 읽어 보세요: Tesla는 2024년에 기어를 전환합니다: Dogecoin에 파급 효과를 미칠까요?
Is DOGE Price Heading to $0.1?
DOGE 가격이 0.1달러로 향하고 있나요?
- The Flag pattern breakout would signal the end of the correction trend.
- A bullish breakout from the flag pattern would indicate the end of the correction trendline.
- The 24-hour trading volume in Dogecoin is $2.58 Billion, indicating a 58% gain.
플래그 패턴 돌파는 조정 추세의 끝을 알리는 신호입니다.
플래그 패턴의 강세 돌파는 조정 추세선의 끝을 나타냅니다.
Dogecoin의 24시간 거래량은 25억 8천만 달러로 58%의 상승률을 나타냅니다.

With a silent beginning anticipated in 2024, the Dogecoin price trend prolongs the correction phase teasing a sharp fall. However, the correction does project a bounce-back possibility when it arrives at a potential retest zone.
2024년 조용한 시작이 예상되는 가운데 Dogecoin 가격 추세는 급격한 하락을 예고하는 조정 단계를 연장합니다. 그러나 수정 사항은 잠재적인 재테스트 영역에 도달하면 반등 가능성을 예상합니다.
The correction phase forms a falling channel pattern in the short term that completes a flag pattern with the prevailing uptrend. With the minor pullback bringing an entry for pullback traders, the 38.20% Fibonacci level highlights an entry at $0.088.
조정 국면에서는 단기적으로 하락 채널 패턴을 형성하여 지배적인 상승 추세와 함께 플래그 패턴을 완성합니다. 사소한 하락으로 인해 하락 거래자가 진입하게 되면서 38.20% 피보나치 수준은 $0.088의 진입을 강조합니다.
The ongoing correction accounts for a drop of 16.2% as the DOGE buyers fail the dominance at the psychological mark of $0.10.
DOGE 구매자가 $0.10의 심리적 지점에서 지배력을 상실함에 따라 지속적인 조정은 16.2%의 하락을 설명합니다.
At press time the DOGE price continues the falling trend in a channel and showcases a potential retest at the bottom support levels at $0.88 and $0.83, provided that the selling pressure is sustained.
보도 시점 현재 DOGE 가격은 채널 내 하락 추세를 이어가고 있으며 매도 압력이 지속된다면 최저 지지 수준인 0.88달러와 0.83달러에서 잠재적인 재시험을 보여줍니다.
However, the immediate support at $0.88 could lead to a quick recovery. On the flip side, a downside potential exists that may challenge the $0.77 support level.
그러나 $0.88의 즉각적인 지원은 빠른 회복으로 이어질 수 있습니다. 반면에 $0.77 지원 수준에 도전할 수 있는 단점이 있습니다.
Pullback Teases Bill Run To $1.4 in January
Pullback은 1월에 청구액이 1.4달러로 상승할 것으로 예상합니다.
The New Year rally brings high anticipation to the bullish trend in the entire crypto market. With the high possibility of a surge in Bitcoin price, the meme coins will find an additional trend momentum to scale new levels.
새해 랠리는 전체 암호화폐 시장의 강세 추세에 대한 높은 기대를 불러일으킵니다. 비트코인 가격이 급등할 가능성이 높기 때문에 밈 코인은 새로운 수준으로 확장할 수 있는 추가적인 추세 모멘텀을 찾을 것입니다.
As the biggest meme coin, Dogecoin prices will skyrocket and gain momentum through their strong community support. Therefore the bull run can reach the $1.4 mark in the coming months.
가장 큰 밈 코인인 Dogecoin 가격은 강력한 커뮤니티 지원을 통해 급등하고 추진력을 얻을 것입니다. 따라서 강세장은 앞으로 몇 달 안에 1.4달러에 도달할 수 있습니다.
- Moving Average Convergence/Divergence: A Bearish crossover state between MACD and signal hints at an active correction trend
- Bollinger Band: The narrow range of the Bollinger Band indicator accentuates increasing volatility and uncertainty in the market.
이동 평균 수렴/발산: MACD와 신호 사이의 약세 교차 상태는 활성 조정 추세를 암시합니다.
볼린저 밴드(Bollinger Band): 볼린저 밴드 지표의 좁은 범위는 시장의 변동성과 불확실성 증가를 강조합니다.
The post Dogecoin Price Prediction Hints Last Pullback Before Hitting $0.12 appeared first on CoinGape.
Dogecoin 가격 예측 게시물은 0.12달러를 기록하기 전 마지막 하락세를 암시합니다. CoinGape에 처음 등장했습니다.


 DogeHome
 Optimisus
 Crypto News Land
 Optimisus
 Cryptopolitan_News
 Cryptopolitan
 crypto.ro English


