

Dogecoin's Recent Price Crash and the Looming Death Cross
Dogecoin의 최근 가격 충돌과 다가오는 죽음의 십자가
Dogecoin (DOGE) has experienced a significant price decline in recent months, reaching a low of $0.019 on Sunday—its lowest point since November 7, 2023. This represents a drop of over 60% from its November high.
Dogecoin (Doge)은 최근 몇 달 동안 상당한 가격 하락을 경험하여 일요일에 0.019 달러에 도달했습니다.
This downturn mirrors the performance of other meme coins, with popular tokens like Shiba Inu, Pepe, and Dogwifhat also experiencing declines of over 50%.
이 침체는 Shiba Inu, Pepe 및 Dogwifhat과 같은 인기있는 토큰과 함께 다른 밈 동전의 성능을 반영합니다.
Elon Musk's influence, a key factor in Dogecoin's past success, has also come under pressure. Reports indicate a substantial decrease in his net worth, impacting investor sentiment.
Dogecoin의 과거 성공의 핵심 요소 인 Elon Musk의 영향력도 압력을 받았습니다. 보고서에 따르면 투자자 감정에 영향을 미쳐 순자산이 상당히 감소한 것으로 나타났습니다.
Further complicating the situation are reports of increasing tensions between Elon Musk and Donald Trump. News outlets suggest friction between Musk and cabinet officials, potentially leading to Musk's departure from a government position. Kalshi data suggests a 54% probability of this departure before July 2026.
상황을 더욱 복잡하게하는 것은 엘론 머스크와 도널드 트럼프 사이의 긴장이 증가한다는보고가있다. 뉴스 매체는 머스크와 내각 관계자 사이의 마찰을 제안하여 Musk가 정부의 입장에서 벗어날 수 있습니다. Kalshi 데이터에 따르면 2026 년 7 월 이전 에이 출발 확률은 54%입니다.
Dogecoin's popularity surge in 2021 was largely attributed to Musk's endorsements. His potential departure from his government role could negatively impact Dogecoin's price.
2021 년 Dogecoin의 인기 급증은 대부분 Musk의 승인에 기인 한 것입니다. 그의 정부의 역할에서 벗어날 수있는 잠재적 인 잠재력은 Dogecoin의 가격에 부정적인 영향을 줄 수 있습니다.
Dogecoin Price Analysis 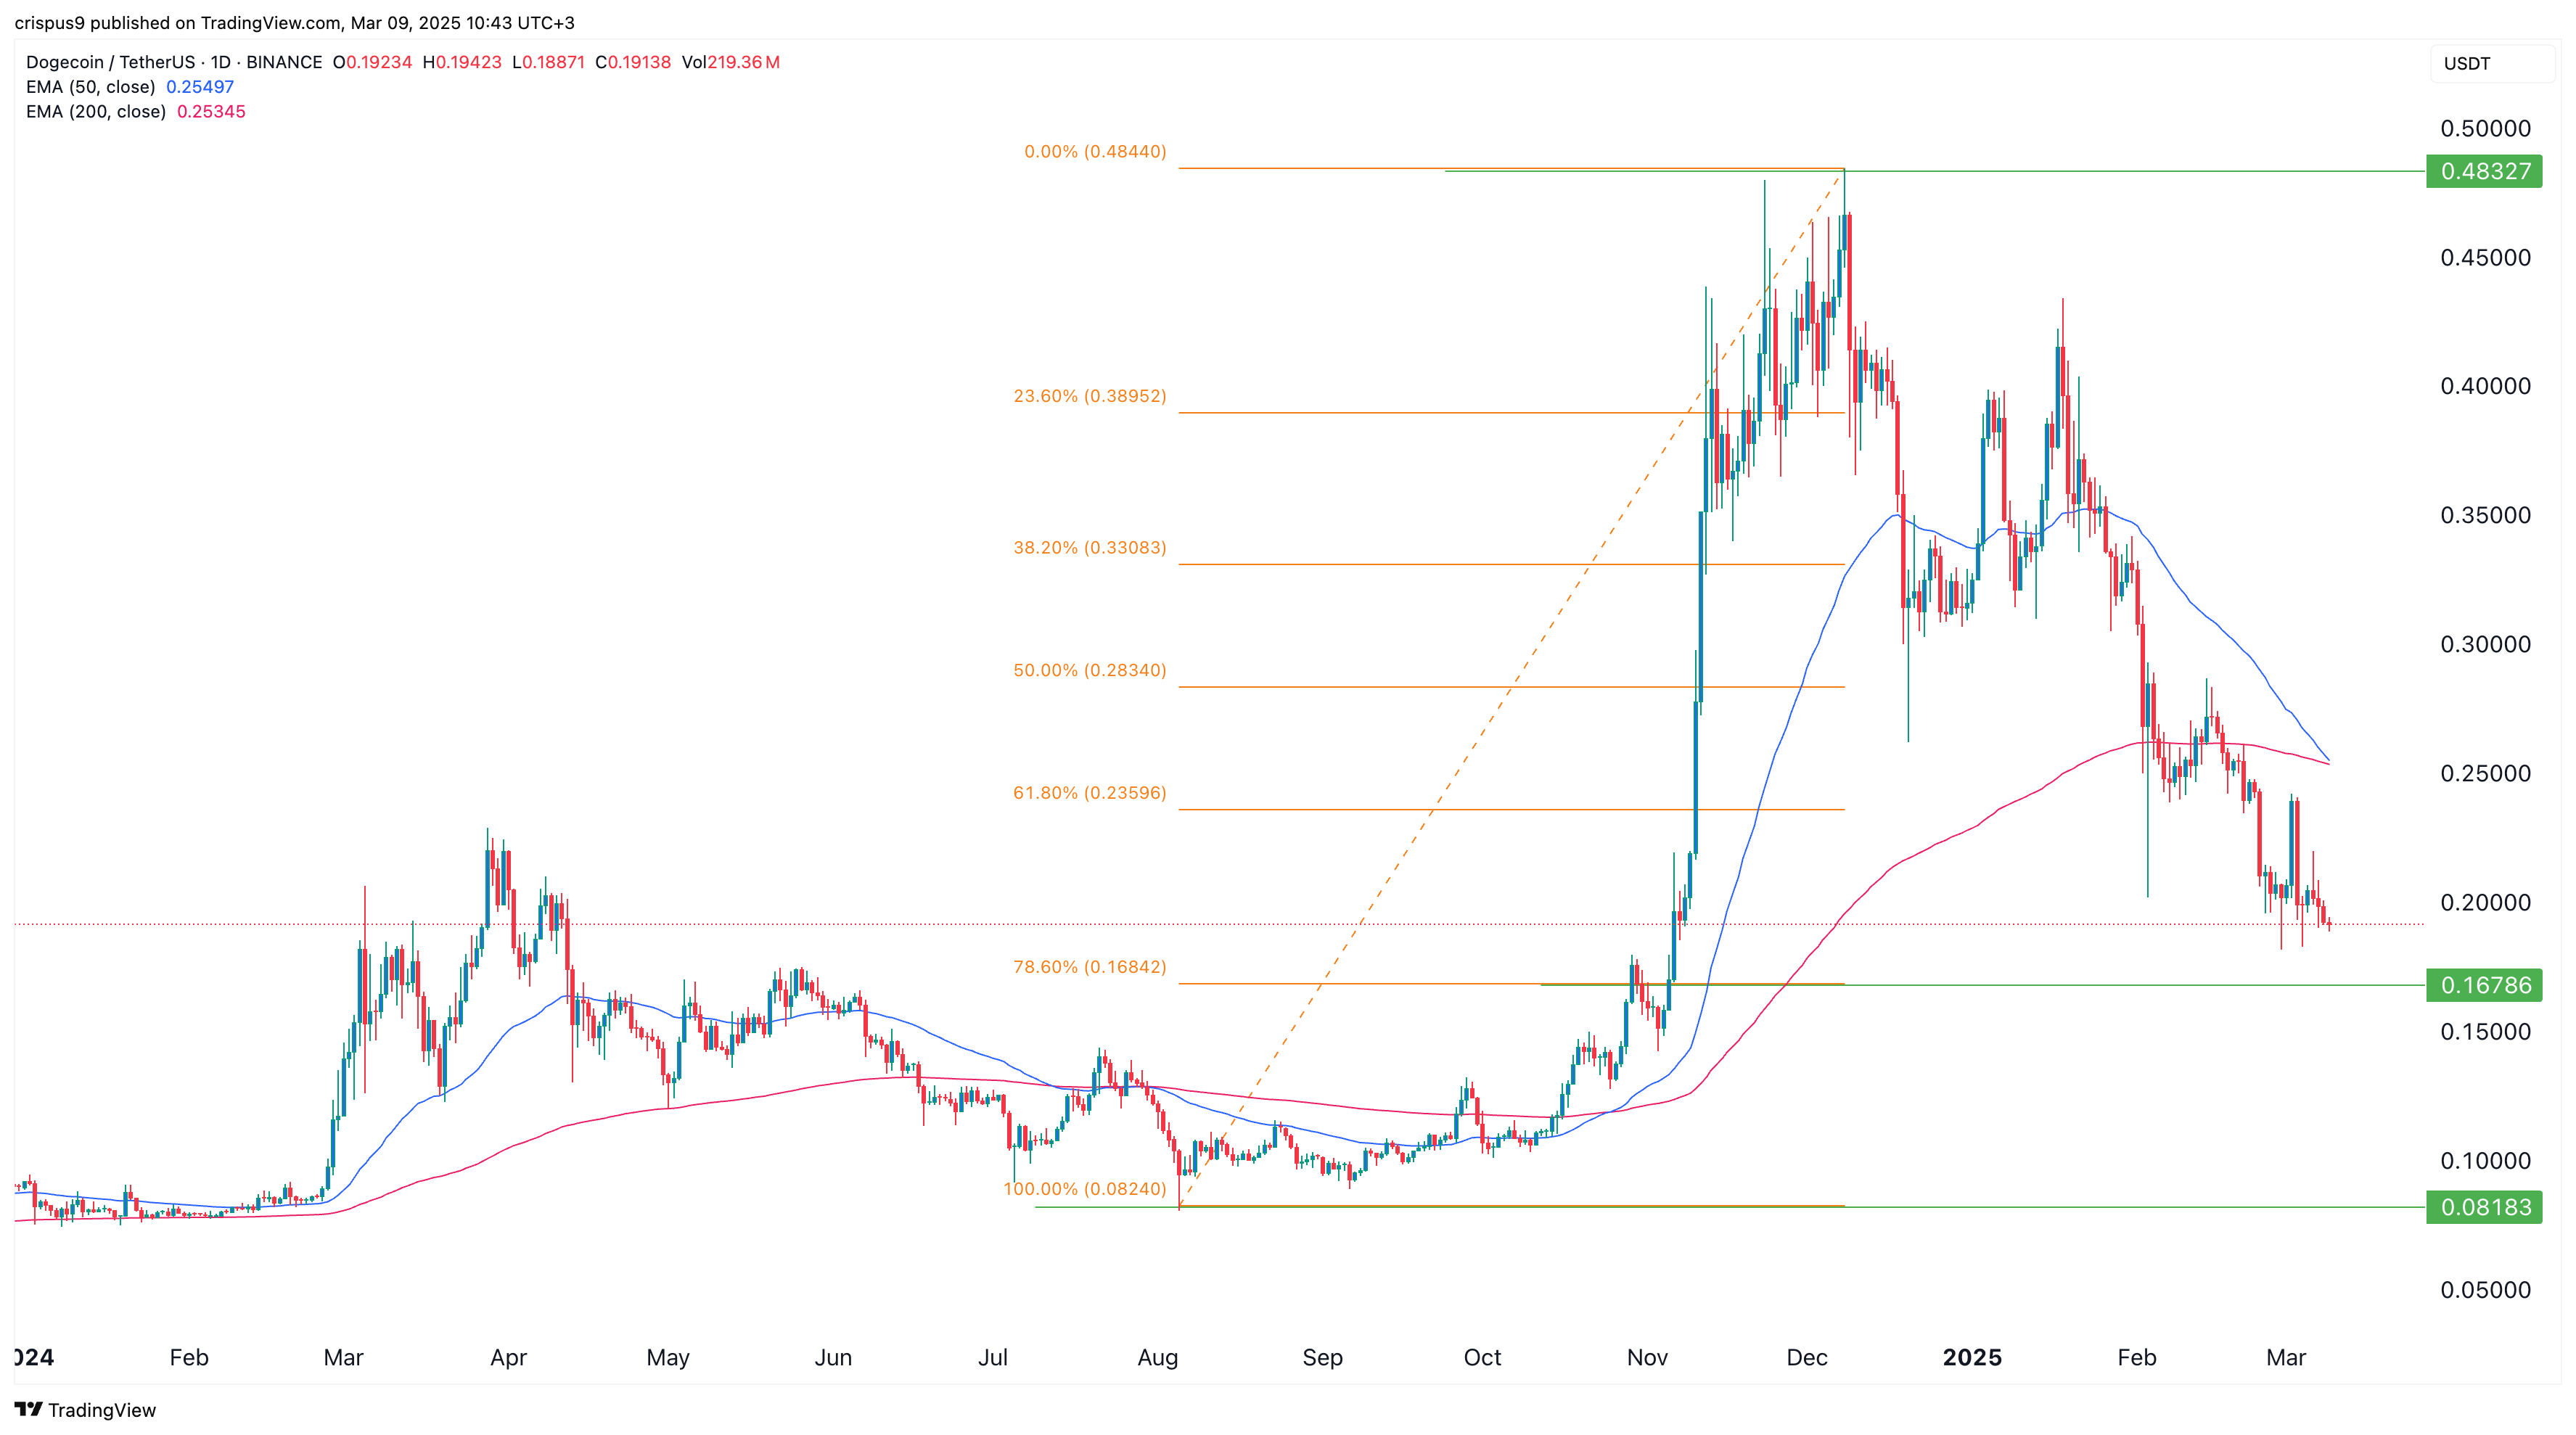
Dogecoin 가격 분석
[Image: DOGE price chart | Source: crypto.news]
[이미지 : Doge 가격 차트 | 출처 : crypto.news]
The daily chart indicates a sustained downtrend, with investors remaining cautious. A death cross pattern—where the 50-day and 200-day Exponential Moving Averages intersect—is imminent. Historically, this pattern has preceded significant price drops (e.g., a 40% drop in July 2024).
일일 차트는 투자자가 신중하게 남아있는 지속적인 하락세를 나타냅니다. 50 일 및 200 일 지수 이동 평균이 교차하는 데스 크로스 패턴이 임박합니다. 역사적으로,이 패턴은 상당한 가격 하락에 앞서 있습니다 (예 : 2024 년 7 월 40% 감소).
DOGE has fallen below the 61.8% Fibonacci Retracement level at $0.2360, suggesting bearish momentum. The MACD and Relative Strength Index also point to continued downward pressure. The next key support level is $0.1680 (78.6% retracement). A break below this could trigger a further decline to $0.08, representing a 60% drop from the current price.
Doge는 61.8% Fibonacci retression 수준이 $ 0.2360 아래로 떨어졌으며, 약세 운동량을 시사합니다. MACD 및 상대 강도 지수는 또한 지속적인 하향 압력을 가리킨다. 다음 주요 지원 수준은 $ 0.1680 (78.6%의 되돌아)입니다. 이 아래의 휴식은 현재 가격에서 60% 하락을 나타냅니다.
 CFN
CFN BlockchainReporter
 Cryptopolitan_News
 DeFi Planet
 TheCoinrise Media
 DogeHome
 CoinoMedia
 COINTURK NEWS
 Cryptopolitan_News


