The post Memecoins Mania Hype Fading Away! Will The Category End This Year On A Bearish Note? appeared first on Coinpedia Fintech News
포스트 Memecoins Mania Hype가 사라지고 있습니다! 올해 카테고리는 약세로 끝날 것인가? Coinpedia Fintech News에 처음 등장
The crypto industry has experienced significant price fluctuations during the past week, indicating a massive ongoing price action in the crypto industry. Further, the memecoins hype seems to have reduced as the top tokens of this category have been constantly trading under a bearish influence for a while.
암호화폐 산업은 지난 주 동안 상당한 가격 변동을 경험했으며 이는 암호화폐 산업에서 엄청난 가격 변동이 진행되고 있음을 나타냅니다. 또한, 이 카테고리의 상위 토큰이 한동안 하락세 영향을 받아 지속적으로 거래되면서 밈코인의 과대 광고가 줄어든 것 같습니다.
Dogecoin Price Analysis:
Dogecoin 가격 분석:
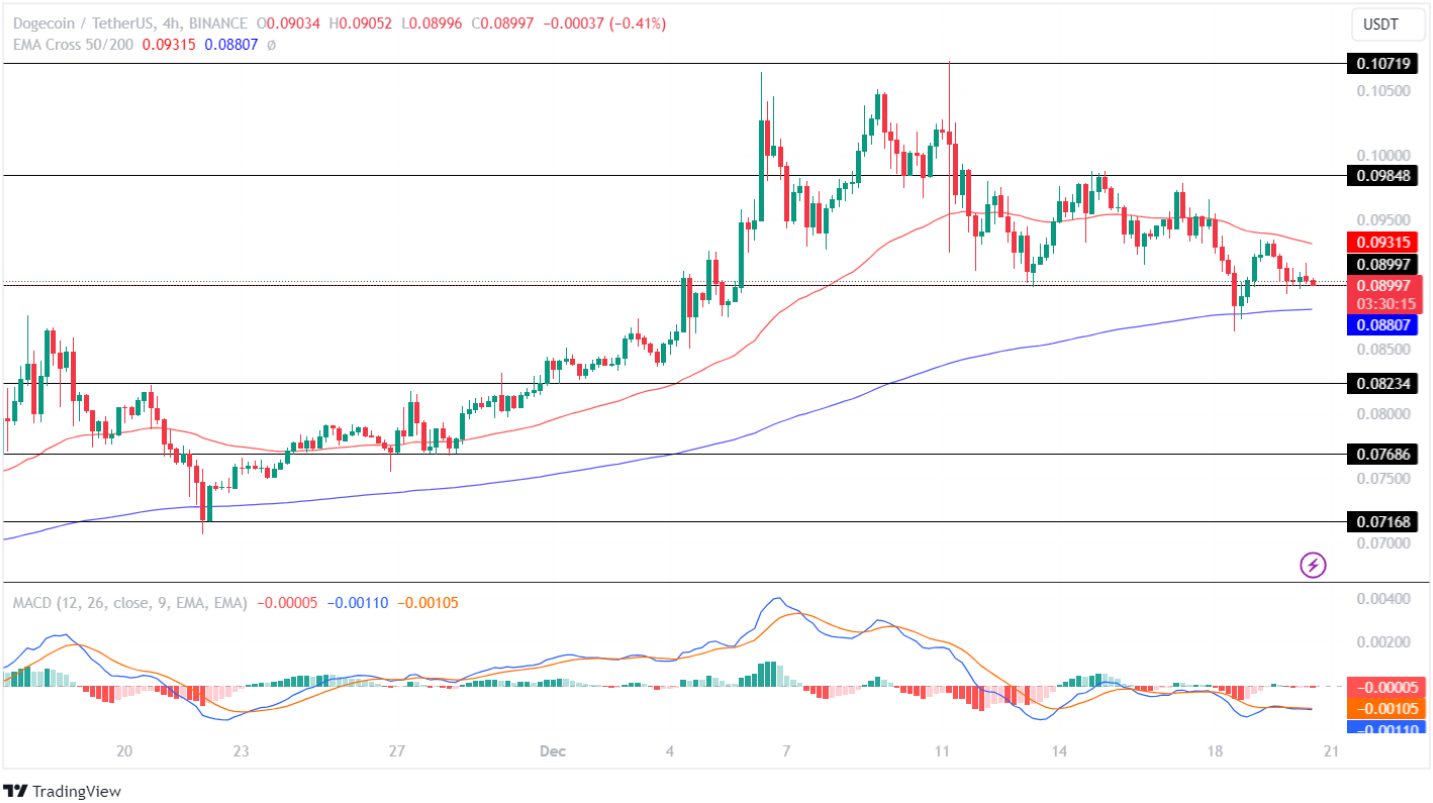
The Dogecoin price traded in a closed range between $0.07686 and $0.08234 for a brief period, following which the bulls lost momentum and the price plunged. The bulls held the price strong, resulting in a bounce back in the range.
Dogecoin 가격은 짧은 기간 동안 $0.07686에서 $0.08234 사이의 폐쇄된 범위에서 거래되었으며, 그 후 강세는 모멘텀을 잃고 가격이 급락했습니다. 황소는 가격을 강하게 유지하여 범위가 반등했습니다.
Further, the DOGE price jumped over 30% before facing rejection at $0.10719. Since then, the price has been constantly trading under a bearish influence and is on the verge of testing its crucial support level at $0.08997, of which the outcome is unpredictable.
또한 DOGE 가격은 30% 이상 급등한 후 $0.10719로 거부되었습니다. 그 이후로 가격은 지속적으로 약세 영향을 받아 거래되었으며 중요한 지원 수준인 $0.08997를 테스트하기 직전이며 결과는 예측할 수 없습니다.

The technical indicator, MACD, displays a constant flatline for a while, indicating weak buying and selling pressure in the market. Further, the averages show a neutral trend, suggesting uncertainty in the future price action for this token.
기술 지표인 MACD는 한동안 일정한 추세를 보이며 시장의 매수 및 매도 압력이 약함을 나타냅니다. 또한 평균은 중립적인 추세를 보여 이 토큰의 향후 가격 조치에 대한 불확실성을 시사합니다.
If the bulls hold the price above the support level of $0.08997, the price will regain momentum and prepare to test its resistance level at $0.09848. Further, if the market continues to gain momentum, it will rise and test its upper resistance level of $0.10719 in the coming days.
상승세가 지지 수준인 $0.08997 이상으로 가격을 유지한다면 가격은 모멘텀을 되찾고 $0.09848에서 저항 수준을 테스트할 준비를 할 것입니다. 또한, 시장이 계속해서 모멘텀을 얻으면 상승하여 앞으로 며칠 내에 상한 저항 수준인 $0.10719를 테스트할 것입니다.
Conversely, if the bears overpowered the bulls, the DOGE price will lose momentum and prepare to test its lower support level at $0.08234 this month.
반대로, 하락세가 상승세를 압도한다면 DOGE 가격은 모멘텀을 잃고 이번 달 0.08234달러로 낮은 지지 수준을 테스트할 준비를 할 것입니다.
Shiba Inu Price Analysis:
시바견 가격 분석:
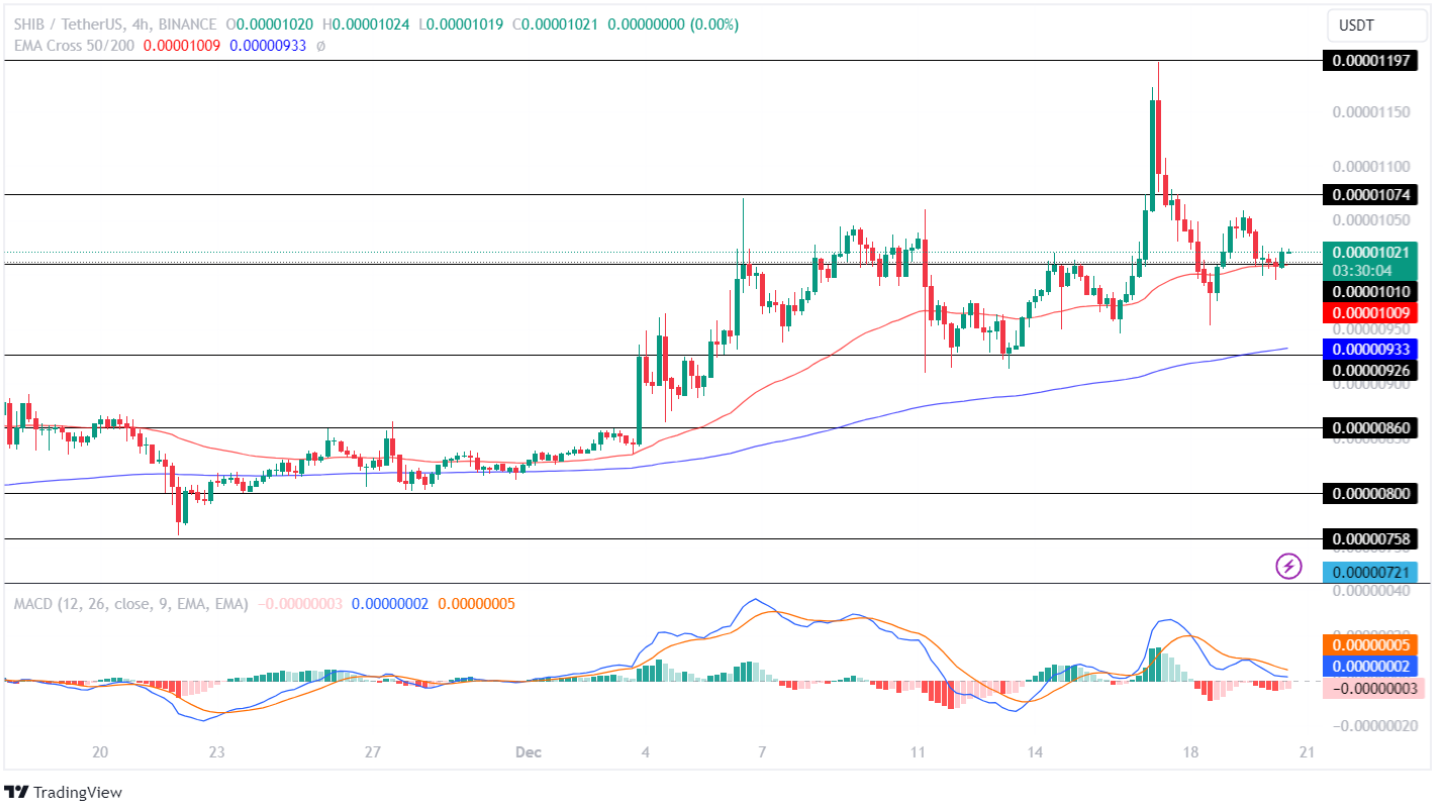
The SHIB price followed in the footsteps of the category leader and traded sideways in a closed range between $0.00000800 and $0.00000860 for a brief period, following which the market gained momentum and the price recorded a jump.
SHIB 가격은 카테고리 리더의 뒤를 이어 짧은 기간 동안 $0.00000800에서 $0.00000860 사이의 닫힌 범위에서 횡보 거래되었으며, 그 후 시장이 추진력을 얻었고 가격은 급등했습니다.
The Shiba Inu price broke out of multiple resistance levels and jumped approximately 25% in value before facing rejection at $0.00001074. Since then, the memecoin has traded sideways between $0.00000926 and $0.00001074.
Shiba Inu 가격은 여러 저항 수준을 벗어나 약 25% 상승한 후 $0.00001074로 거부되었습니다. 그 이후로 memecoin은 $0.00000926에서 $0.00001074 사이에서 횡보 거래되었습니다.

The Moving Average Convergence Divergence (MACD) displays a constant red histogram, indicating a higher selling-over-buying pressure in the market. Moreover, the averages show a decline, suggesting the price will continue losing momentum in the coming time.
MACD(Moving Average Convergence Divergence)는 일정한 빨간색 히스토그램을 표시하며 이는 시장에서 매수 대비 매도 압력이 더 높다는 것을 나타냅니다. 더욱이 평균은 하락세를 보이고 있으며, 이는 가격이 앞으로도 계속해서 모멘텀을 잃을 것임을 시사합니다.
If the bulls hold the price above the support level of $0.00001010, the SHIB price will regain momentum and prepare to test its resistance level of $0.00001074 in the coming days.
상승세가 지지 수준인 $0.00001010 이상으로 가격을 유지한다면 SHIB 가격은 모멘텀을 되찾고 며칠 내에 저항 수준인 $0.00001074를 테스트할 준비를 할 것입니다.
On the flip side, if the bears overpowered the bulls, the price would lose momentum and fall to test its support level of $0.000009226. Moreover, if the bears continue to dominate the market, it will plunge further and test its lower support level of $0.00000860 this month.
반대로, 하락세가 상승세를 압도한다면 가격은 모멘텀을 잃고 $0.000009226의 지원 수준을 테스트하기 위해 하락할 것입니다. 더욱이 하락세가 계속해서 시장을 지배한다면 하락세가 더 심해 이번 달에 더 낮은 지지 수준인 0.00000860달러를 테스트하게 될 것입니다.
Bonk Price Analysis:
봉크 가격 분석:
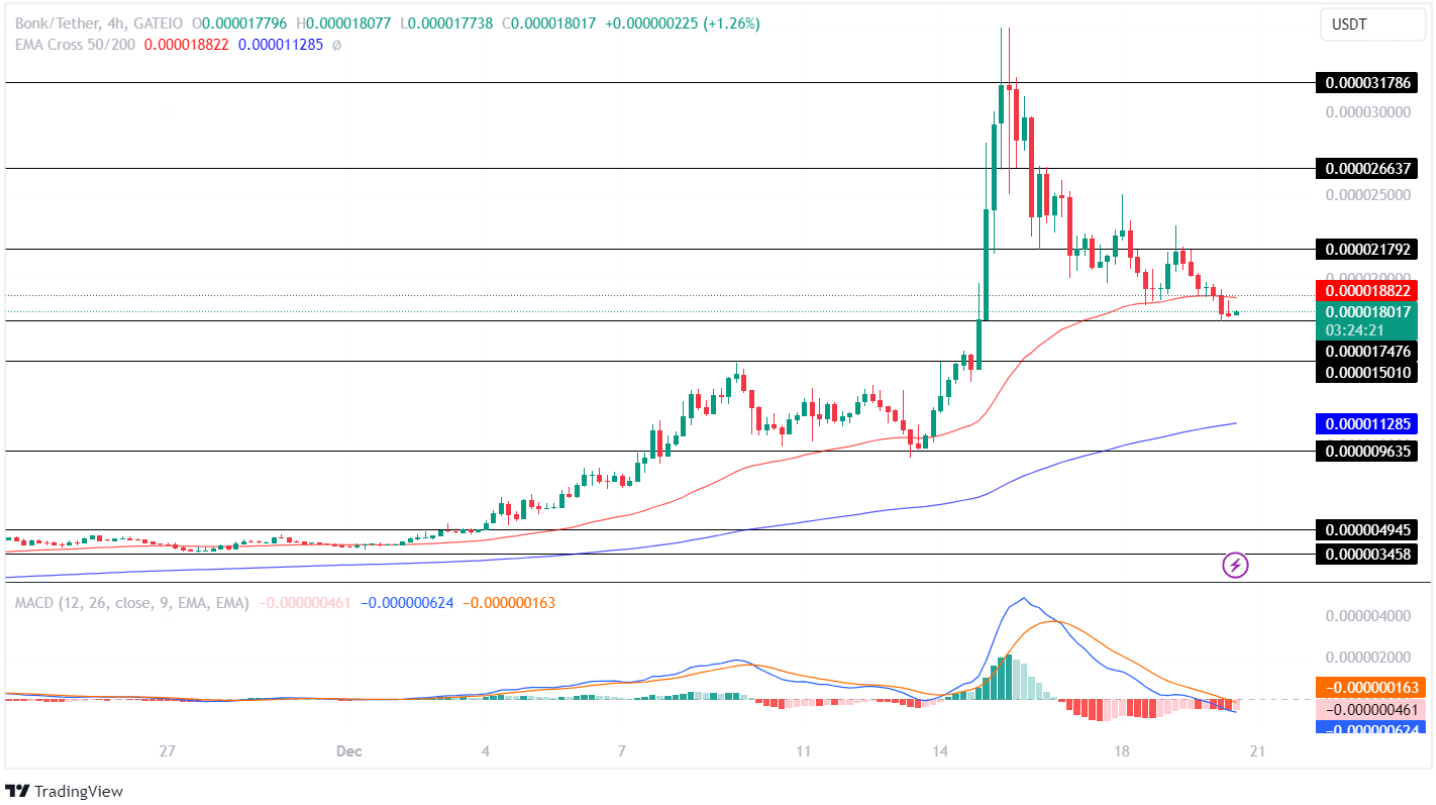
The BONK price traded in a narrow space between $0.000003458 and $0.000004945 for a brief period, after which the market gained momentum, and the bulls recorded a massive surge in its value.
BONK 가격은 짧은 기간 동안 $0.000003458에서 $0.000004945 사이의 좁은 공간에서 거래된 후 시장이 모멘텀을 얻었고 상승세는 그 가치가 크게 급등했습니다.
The Bonk price jumped over 200% before facing rejection at $0.000015010. After trading sideways for a while, the price regained momentum and recorded another jump of 111%, after which it faced restriction at $0.000031786. Since then, the price has been trading under a bearish influence.
Bonk 가격은 $0.000015010에서 거부되기 전까지 200% 이상 급등했습니다. 한동안 횡보세를 보인 후 가격은 모멘텀을 되찾고 111%의 또 다른 급등을 기록한 후 $0.000031786에서 제한을 받았습니다. 이후 가격은 약세 영향을 받으며 거래되고 있습니다.

The MACD shows a constant red histogram in the chart, highlighting a strong bearish influence in the market. Further, the averages display a drop, suggesting the price will continue experiencing a correction in the coming days.
MACD는 차트에 일정한 빨간색 히스토그램을 표시하여 시장에 강한 약세 영향을 미치고 있음을 강조합니다. 또한 평균이 하락세를 보이고 있어 가격이 앞으로 며칠 동안 계속해서 조정될 것임을 시사합니다.
If the bulls hold the price above the important support level of $0.000017476, the price will regain momentum and prepare to test its resistance level of $0.00002179. Further, if the market holds the price at that level, it will rise and test its upper resistance level of $0.00002663.
상승세가 중요한 지지 수준인 $0.000017476 이상으로 가격을 유지한다면 가격은 모멘텀을 되찾고 저항 수준인 $0.00002179를 테스트할 준비를 할 것입니다. 또한 시장이 해당 수준에서 가격을 유지한다면 상승하여 $0.00002663의 상한 저항 수준을 테스트하게 됩니다.
Conversely, if the bears pull the price below the support level of $0.000017476, the price will lose momentum and fall to test its lower support level of $0.000015010.
반대로, 하락세가 지지 수준인 $0.000017476 아래로 가격을 끌어내리면 가격은 모멘텀을 잃고 하락하여 낮은 지지 수준인 $0.000015010을 테스트하게 됩니다.
PEPE Price Analysis:
PEPE 가격 분석:
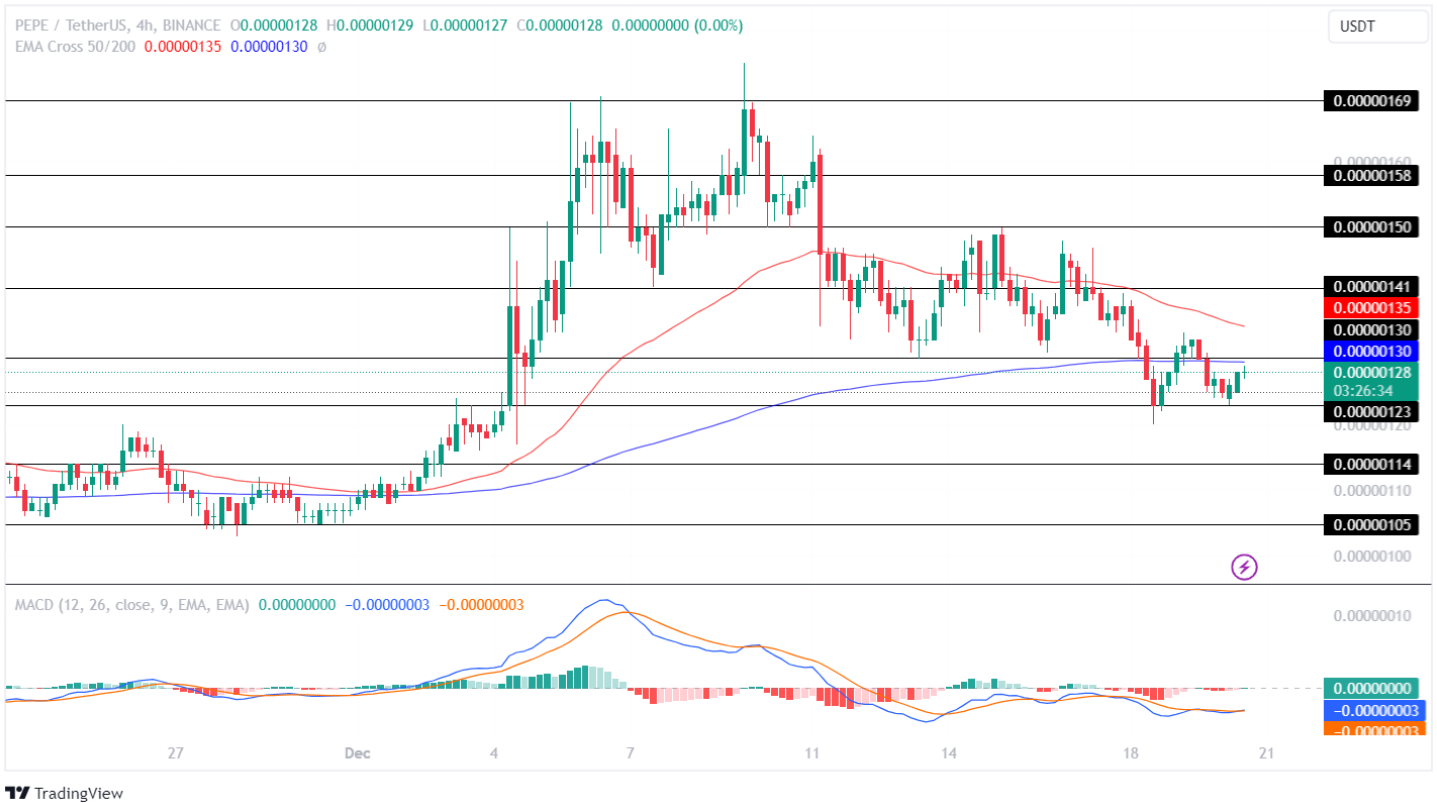
The memecoin traded in a closed range between $0.00000105 and $0.00000114 for over two weeks, after which the PEPE price gained momentum and jumped 61% before facing rejection at $0.0000169.
Memecoin은 2주 넘게 $0.00000105에서 $0.00000114 사이의 닫힌 범위에서 거래되었으며, 그 후 PEPE 가격은 탄력을 받아 $0.0000169에서 거부되기 전에 61% 급등했습니다.
Following this, the price traded sideways in a consolidated range between $0.00000150 and $0.00000169 for about a week. Since then, the price has been trading under a bearish influence and has recorded a correction of over 27% during the past week.
이후 가격은 약 일주일 동안 $0.00000150~$0.00000169 사이의 통합 범위에서 횡보 거래되었습니다. 그 이후로 가격은 약세 영향을 받으며 거래되었으며 지난 주 동안 27% 이상의 조정을 기록했습니다.

The technical indicator MACD continues to display a flatline in the chart, suggesting a decline in the buying and selling pressure for the coin in the market. Moreover, the averages show a neutral trend, highlighting an uncertainty in the future price action for this memecoin.
기술 지표 MACD는 차트에 계속해서 평평한 선을 표시하고 있으며 이는 시장에서 코인에 대한 매수 및 매도 압력이 감소하고 있음을 나타냅니다. 더욱이, 평균은 중립적인 추세를 보여 이 밈코인의 미래 가격 행동에 대한 불확실성을 강조합니다.
If the bulls push the price above the resistance level of $0.00000130, the price will regain momentum and prepare to test its resistance level of $0.00000141. Maintaining the price at that level will set the stage for Pepe coin to test its upper resistance level of $0.00000150.
상승세가 저항 수준인 $0.00000130 위로 가격을 올리면 가격은 모멘텀을 되찾고 저항 수준 $0.00000141을 테스트할 준비를 하게 됩니다. 이 수준에서 가격을 유지하면 Pepe 코인이 $0.00000150의 상위 저항 수준을 테스트할 수 있는 기반이 마련됩니다.
Negatively, if a trend reversal occurs, the price will lose momentum and prepare to test its lower support level of $0.00000114 this week. Moreover, if the bears continue to dominate the market, it will plunge further and prepare to test its crucial support level of $0.00000105.
부정적으로, 추세 반전이 발생하면 가격은 모멘텀을 잃고 이번 주에 더 낮은 지지 수준인 $0.00000114를 테스트할 준비를 할 것입니다. 더욱이 하락세가 계속해서 시장을 지배한다면 하락세는 더 커져 중요한 지원 수준인 $0.00000105를 테스트할 준비를 할 것입니다.


 DogeHome
 TheCoinrise Media
 Thecoinrepublic.com
 TheCoinrise Media
 TheCoinrise Media
 Cryptopolitan_News
 Coin Edition
 BlockchainReporter


