Pepe Coin Maintains Resilience Amidst Sluggish Crypto Market
Pepe Coin은 부진한 암호화폐 시장 속에서 탄력성을 유지합니다
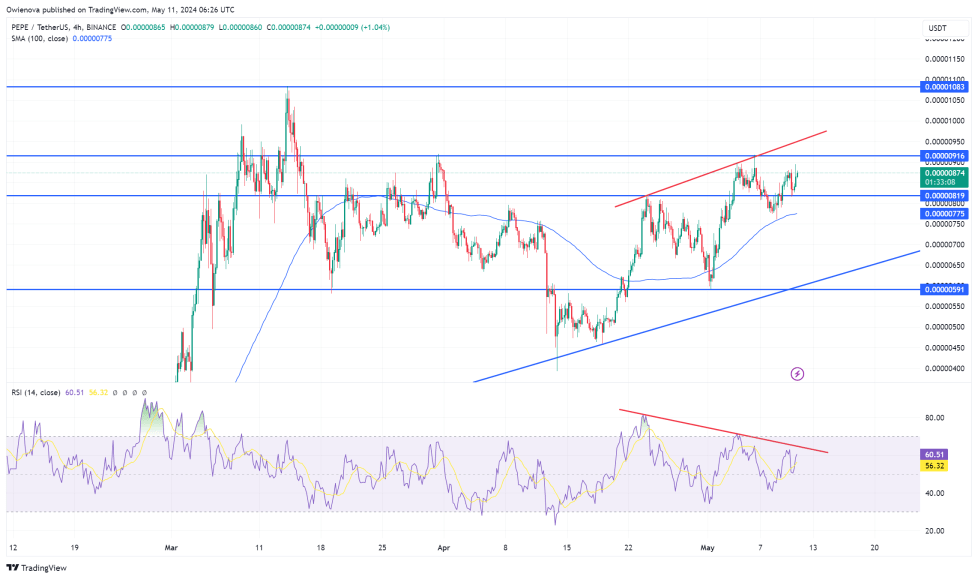
Amidst the prevailing sluggishness in the major crypto markets, Pepe Coin has managed to retain its position with impressive resilience. This resilience is highlighted by its ability to maintain its trading price above both the 100-day SMA and the trendline, key indicators of its robustness amidst market volatility.
주요 암호화폐 시장의 부진이 만연한 가운데 Pepe Coin은 인상적인 회복력으로 그 위치를 유지해 왔습니다. 이러한 탄력성은 시장 변동성 속에서도 견고함을 나타내는 주요 지표인 100일 SMA와 추세선 이상으로 거래 가격을 유지할 수 있는 능력으로 강조됩니다.
Pepe Coin's Market Resilience
Pepe Coin의 시장 탄력성
Pepe Coin, boasting a total liquidity of over $38 million and a 24-hour trading volume exceeding $4.9 million, experienced a brief dip below its moving averages. However, as reported by Bitcoinist, the token found support at the trendline and has since rebounded, consistently trading above this crucial marker. This recovery signifies strong market presence and investor confidence.
총 3,800만 달러 이상의 유동성과 490만 달러가 넘는 24시간 거래량을 자랑하는 Pepe 코인은 이동 평균 아래로 잠시 하락했습니다. 그러나 Bitcoinist가 보고한 바와 같이 토큰은 추세선에서 지지를 찾았고 이후 반등하여 지속적으로 이 중요한 지표 위에서 거래되었습니다. 이러한 회복은 강력한 시장 입지와 투자자의 신뢰를 의미합니다.
At the time of writing, Pepe trades at $0.00000872, marking an increase of approximately 3.57% over the past 24 hours.
이 글을 쓰는 시점에서 Pepe는 $0.00000872에 거래되어 지난 24시간 동안 약 3.57% 증가했습니다.
This bullish trend is not a momentary spike but rather a sign of sustained growth, as evidenced by several technical indicators that suggest the potential for continued upward movement.
이러한 강세 추세는 일시적인 상승이 아니라 오히려 지속적인 성장의 신호입니다. 지속적인 상승 가능성을 시사하는 여러 기술 지표에서 알 수 있듯이 말입니다.
Technical Indicators Signal Bullish Potential
기술 지표는 강세 잠재력을 나타냅니다.
Focusing on the 4-hour RSI indicator, we observe that the RSI line is comfortably above the 50 level, which typically indicates a bullish market scenario. Furthermore, a divergence has been noted between the price action and the RSI line, marked by the red line in the analysis, hinting at a possible future price correction.
4시간 RSI 지표에 초점을 맞춰 보면 RSI 선이 일반적으로 강세 시장 시나리오를 나타내는 50 수준 위에 있다는 것을 알 수 있습니다. 또한 분석에서 빨간색 선으로 표시된 가격 움직임과 RSI 선 사이에 차이가 확인되어 향후 가격 조정 가능성을 암시합니다.

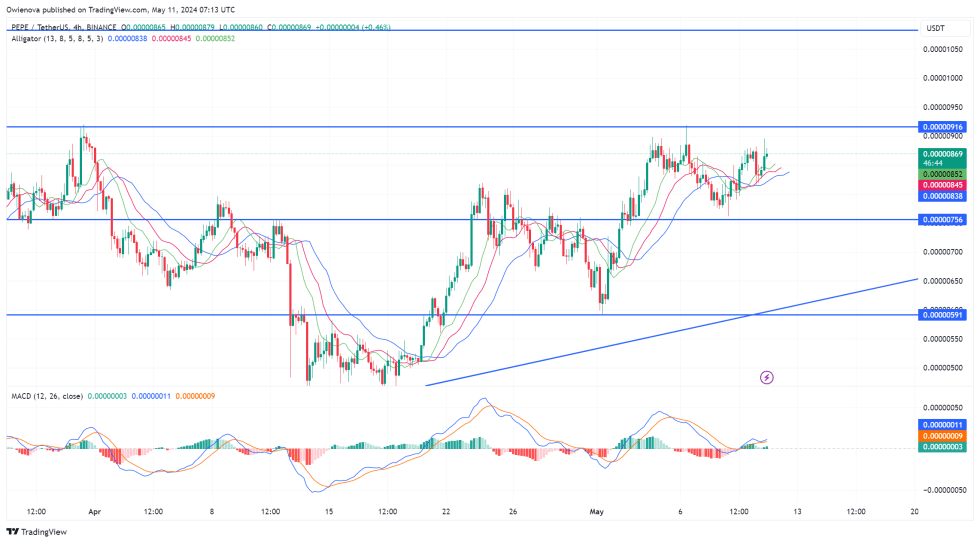
Similarly, the 4-hour MACD indicator provides further insights. Both the MACD line and the signal line have crossed above the zero line, reinforcing the bullish trend. Additionally, the MACD histogram remains positive, confirming the ongoing positive sentiment surrounding Pepe Coin.
마찬가지로 4시간 MACD 지표도 더 많은 통찰력을 제공합니다. MACD선과 시그널선이 모두 0선을 상향 교차하여 강세 추세를 강화하고 있습니다. 또한 MACD 히스토그램은 긍정적인 상태를 유지하여 Pepe Coin을 둘러싼 지속적인 긍정적인 감정을 확인시켜 줍니다.

Another promising indicator is the 4-hour Alligator, which shows that Pepe Coin is trading above both the alligator's lips and teeth, two key lines of this indicator. After a brief dip below these lines, the price has surged above them once again, suggesting strong potential for continued upward movement.
또 다른 유망한 지표는 4시간 악어입니다. 이는 Pepe 코인이 이 지표의 두 가지 핵심 라인인 악어의 입술과 이빨 위에서 거래되고 있음을 보여줍니다. 이 선 아래로 잠시 하락한 후 가격이 다시 한 번 그 선 위로 급등하여 지속적인 상승 가능성이 있음을 시사합니다.
Approaching Resistance Levels
저항 수준에 접근 중
As Pepe approaches the resistance level of $0.00000916, the market's response will be key. A breakout past this resistance could propel the token towards retesting its all-time high.
Pepe가 저항 수준인 $0.00000916에 접근함에 따라 시장의 반응이 핵심이 될 것입니다. 이 저항을 돌파하면 토큰이 사상 최고치를 다시 테스트하는 방향으로 나아갈 수 있습니다.
Such a move would not only solidify its current position but also potentially attract more investors seeking strong performance amidst the turbulent market.
이러한 움직임은 현재의 위치를 확고히 할 뿐만 아니라 격동하는 시장 속에서 강력한 성과를 추구하는 더 많은 투자자를 잠재적으로 끌어들이게 될 것입니다.

Conversely, a failure to surpass the resistance could lead to a price retracement towards the previous support of $0.00000756. If a breakdown occurs below this threshold, further declines could target lower support at $0.00000591, providing a significant test of Pepe Coin's market resilience.
반대로, 저항선을 넘지 못하면 이전 지지선인 $0.00000756을 향해 가격이 되돌려질 수 있습니다. 이 임계값 이하로 고장이 발생하면 추가 하락은 $0.00000591의 낮은 지원을 목표로 하여 Pepe Coin의 시장 탄력성에 대한 중요한 테스트를 제공할 수 있습니다.


 Coin Edition
 Optimisus
 TheCoinrise Media
 DogeHome
 Optimisus
 BH NEWS
 The Blockopedia
 COINTURK NEWS
 Crypto News Land


