- DOGE’s price performed better as DOT became relatively stable.
- Increasing bullish momentum could drive DOT toward $10.
DOGE의 가격은 DOT가 상대적으로 안정되면서 더 나은 성과를 보였습니다.
강세 모멘텀이 증가하면 DOT가 10달러를 향해 나아갈 수 있습니다.
Despite being three places lower than Dogecoin [DOGE] per market cap, liquidity in the Polkadot [DOT] ecosystem has become higher than the former.
시가총액 기준으로 Dogecoin[DOGE]보다 3계단 낮음에도 불구하고 Polkadot[DOT] 생태계의 유동성은 이전보다 높아졌습니다.
According to CoinMarketCap, DOT’s liquidity score on Binance was 760. DOGE, on the other hand, had a score of 731.
CoinMarketCap에 따르면 바이낸스에서 DOT의 유동성 점수는 760점이었습니다. 반면 DOGE는 731점을 기록했습니다.
The liquidity score in the cryptocurrency market ranges from zero to 1000. A perfect score of 1000 implies that the market has low slippage.
암호화폐 시장의 유동성 점수 범위는 0부터 1000까지입니다. 1000점 만점은 시장의 슬리피지가 낮다는 것을 의미합니다.
In this instance, the asset in question is less volatile, and the order size on the buy and sell side could be up to $200,000.
이 경우 문제의 자산은 변동성이 적으며 구매 및 판매 측 주문 규모는 최대 $200,000일 수 있습니다.
More for DOGE, less for DOT
DOGE에는 더 많은 것, DOT에는 더 적은 것
On the other hand, a liquidity score of zero implies that traders are speculating a wide buy and sell price, indicating high volatility. The disparity in liquidity seems to have affected the price of DOGE and DOT.
반면, 유동성 점수가 0이라는 것은 거래자가 광범위한 매수 및 매도 가격을 추측하고 있음을 의미하며 이는 높은 변동성을 나타냅니다. 유동성 불균형이 DOGE와 DOT의 가격에 영향을 미친 것으로 보입니다.
Previously, AMBCrypto reported how Dogecoin’s price has been relatively stable for a while.
이전에 AMBCrypto는 Dogecoin의 가격이 한동안 상대적으로 안정적이었다고 보고했습니다.
However, the last 24 hours have seen the value climb by almost 4.97%. This implies that the coin seems to be returning to its highly volatile state last recorded in 2021.
그러나 지난 24시간 동안 가치는 거의 4.97% 상승했습니다. 이는 해당 코인이 2021년에 마지막으로 기록된 높은 변동성 상태로 되돌아가고 있는 것으로 보인다는 것을 의미합니다.
Like DOGE, the price of the Polkadot token increased. But its performance within the same period was about less than half compared to Dogecoin.
DOGE와 마찬가지로 Polkadot 토큰의 가격이 상승했습니다. 하지만 같은 기간 동안의 성과는 도지코인에 비해 절반도 안 되는 수준이었습니다.
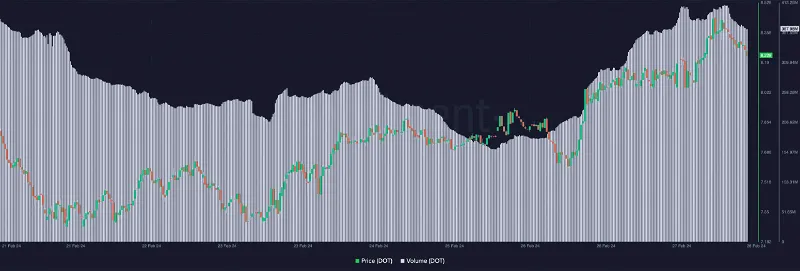
A look at on-chain data showed that DOT’s volume significantly increased over the last three days. The increase in volume suggests that more traders had been involved in buying and selling DOT.
온체인 데이터를 살펴보면 DOT의 거래량이 지난 3일 동안 크게 증가한 것으로 나타났습니다. 거래량이 증가한 것은 더 많은 트레이더가 DOT 구매 및 판매에 참여했음을 의미합니다.
Between the 24th and 25th of February, the volume declined, indicating winding interest in the token.
2월 24일과 25일 사이에 거래량이 감소하여 토큰에 대한 관심이 줄어들었음을 나타냅니다.
AMBCrypto’s assessment of DOT’s price in the last hour showed that it had stalled. An increasing volume and stalling price action might not be good news for a cryptocurrency’s potential rise.
AMBCrypto가 지난 한 시간 동안 DOT 가격을 평가한 결과 가격이 정체된 것으로 나타났습니다. 거래량이 증가하고 가격이 정체되는 것은 암호화폐의 잠재적 상승에 대한 좋은 소식이 아닐 수도 있습니다.
Instead, it implies that the upswing had become weak, and the value might continue to fall.
대신 상승세가 약해졌고 가치가 계속 하락할 수도 있다는 뜻입니다.
Bulls set to change DOT’s status
황소는 DOT의 상태를 변경하도록 설정되었습니다.
Polkadot’s price at press time was $8.25. With this in place, it was likely for it to drop below the $8 region. But we can’t be certain unless we check the technical perspective.
보도 당시 Polkadot의 가격은 8.25달러였습니다. 이것이 시행되면 8달러 지역 아래로 떨어질 가능성이 높습니다. 하지만 기술적인 관점을 확인하지 않으면 확신할 수 없습니다.
According to the DOT/USD chart, the token went through a consolidation phase between the 20th and 24th of February. During that time, the price moved between $7.30 and $7.65.
DOT/USD 차트에 따르면 토큰은 2월 20일부터 24일 사이에 통합 단계를 거쳤습니다. 그 기간 동안 가격은 7.30달러에서 7.65달러 사이에서 움직였습니다.
However, bulls were able to build support around $7.56 where the 0.618 Fibonacci retracement was located.
그러나 황소는 0.618 피보나치 되돌림이 위치한 $7.56 부근에서 지지를 구축할 수 있었습니다.
With increased buying pressure, DOT breached the $7.90 resistance as the price climbed above $8 later. As of this writing, the Relative Strength Index (RSI) was 64.75, indicating that buyers were still present.
구매 압력이 높아지면서 DOT는 나중에 가격이 8달러 이상으로 상승하면서 7.90달러 저항을 돌파했습니다. 이 글을 쓰는 시점에서 상대강도지수(RSI)는 64.75로 구매자가 여전히 존재함을 나타냅니다.
Previously, the RSI hit an overbought region as its reading crossed 70.00. This caused DOT’s price to retrace from $8.44.
이전에는 RSI가 70.00을 넘으면서 과매수 영역에 도달했습니다. 이로 인해 DOT의 가격이 $8.44에서 되돌려졌습니다.
Furthermore, the Moving Average Convergence Divergence (MACD) was positive, suggesting a bullish momentum.
또한 MACD(Moving Average Convergence Divergence)가 긍정적으로 상승 모멘텀을 시사했습니다.
Realistic or not, here’s DOT’s market cap in DOGE terms
현실적이든 아니든, DOGE 기준으로 DOT의 시가총액은 다음과 같습니다.
From the look of things, DOT’s price might pull back lower than $8. However, a quick return above the region remains an option.
사물의 모습으로 볼 때 DOT의 가격은 8달러 미만으로 하락할 수 있습니다. 그러나 해당 지역 위로 빠르게 복귀하는 것은 여전히 선택 사항입니다.
If volatility around the cryptocurrency increases, then the price might climb toward $10 in the short term. If not, DOT might keep trading between $7.03 and $8.50.
암호화폐 주변의 변동성이 증가하면 가격은 단기적으로 10달러까지 오를 수 있습니다. 그렇지 않은 경우 DOT는 $7.03에서 $8.50 사이에서 거래를 계속할 수 있습니다.


 crypto.news
 Thecryptoupdates
 crypto.news
 BlockchainReporter
 Optimisus
 DogeHome
 CoinoMedia
 Inside Bitcoins


