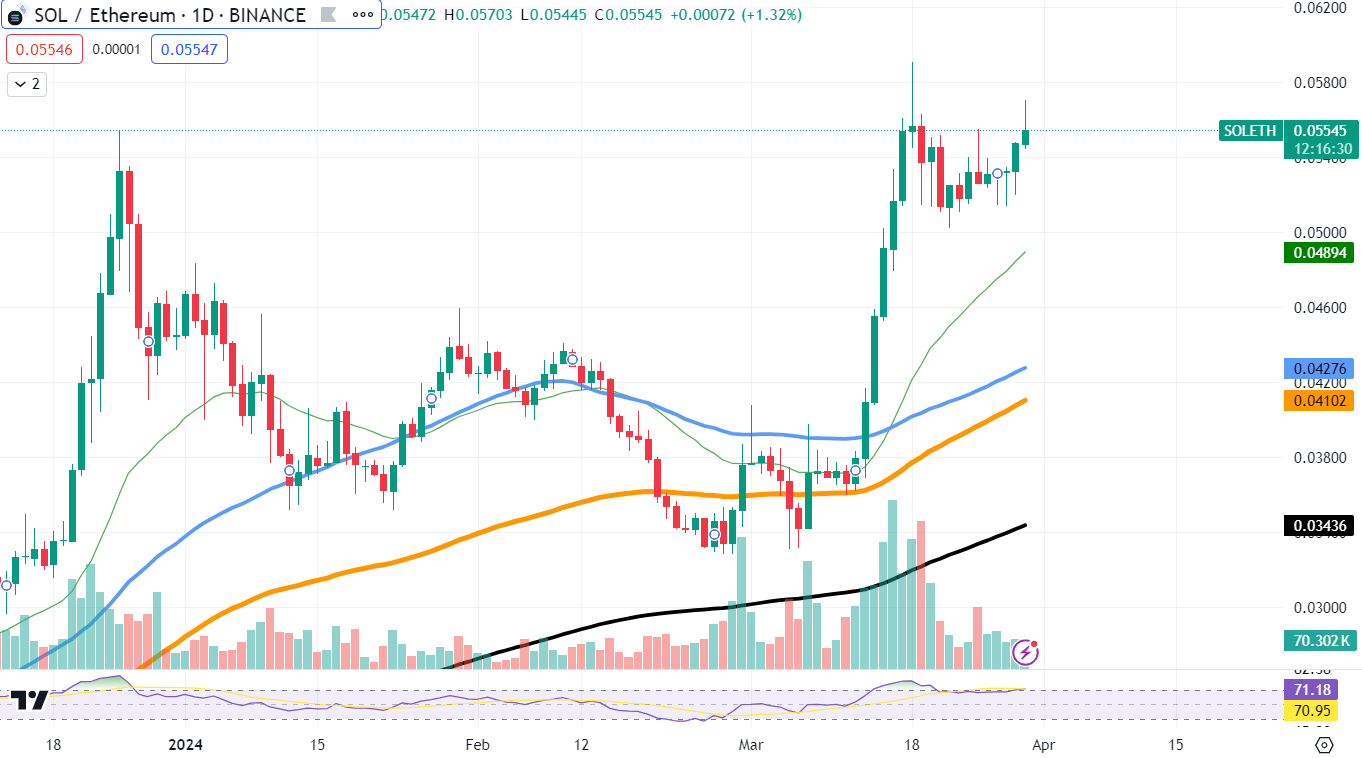
Solana has broken out of a pattern called a "symmetrical triangle" on the chart. This is important because it often means that the price could go up more.
솔라나는 차트에서 '대칭 삼각형'이라는 패턴을 벗어났습니다. 이는 종종 가격이 더 오를 수 있다는 것을 의미하기 때문에 중요합니다.
The symmetrical triangle pattern is made when the price of something like Solana goes up and down between two lines that are coming closer together. This pattern can show that traders are unsure about buying or selling more. But when the price breaks through one of these lines, it can mean that a volatility surge is incoming.
대칭 삼각형 패턴은 솔라나와 같은 가격이 서로 가까워지는 두 선 사이에서 오르락내리락할 때 만들어집니다. 이 패턴은 트레이더가 더 많이 구매하거나 판매하는 것에 대해 확신이 없다는 것을 보여줄 수 있습니다. 그러나 가격이 이 선 중 하나를 돌파하면 변동성 급증이 다가오고 있음을 의미할 수 있습니다.
 SOL/ETH Chart by TradingView
TradingView SOL/ETH 차트
For Solana, the price has broken above the top line of the triangle. This suggests that people are ready to buy more SOL, which could push the price even higher. At the moment, Solana is trading at 0.05569 against Ethereum (ETH). If Solana can stay above this level, it could mean that it will keep growing stronger.
솔라나의 경우 가격이 삼각형 상단선을 넘어섰습니다. 이는 사람들이 더 많은 SOL을 구매할 준비가 되어 있음을 의미하며, 이로 인해 가격이 더욱 높아질 수 있습니다. 현재 솔라나는 이더리움(ETH) 대비 0.05569에 거래되고 있습니다. 솔라나가 이 수준 이상을 유지할 수 있다면 이는 계속해서 더 강해질 것이라는 의미일 수 있습니다.
The next big level for Solana to reach is 0.06000 against Ethereum. If it gets there and can stay above, it might keep going up. But if the price starts to fall, there is a support level at 0.04895 that could help prevent it from going down too much.
솔라나가 도달할 다음 큰 수준은 이더리움 대비 0.06000입니다. 거기에 도달하여 위에 머물 수 있다면 계속 올라갈 수 있습니다. 그러나 가격이 하락하기 시작하면 0.04895에 지지 수준이 있어 가격이 너무 많이 하락하는 것을 방지할 수 있습니다.
XRP on verge of surge?
급등 직전의 XRP?
XRP's price looks like it is getting ready for a big change. Recently, its price has been very steady without much up and down movement, which can be a sign that a bigger price move is coming soon.
XRP의 가격은 큰 변화를 준비하고 있는 것처럼 보입니다. 최근에는 가격이 크게 오르락내리락하지 않고 매우 안정적으로 유지되고 있는데, 이는 곧 더 큰 가격 변동이 있을 것이라는 신호일 수 있습니다.
Looking at the XRP chart, we can see that the price is in a tight space between two important levels. The support level, where we might see XRP's value start ascending, is at $0.5781. This has been a strong threshold for XRP in the past. On the other hand, there is a resistance level at $0.6259, which is like a ceiling that the price has had trouble breaking through.
XRP 차트를 보면 가격이 두 가지 중요한 수준 사이의 좁은 공간에 있다는 것을 알 수 있습니다. XRP의 가치가 상승하기 시작할 수 있는 지원 수준은 $0.5781입니다. 이는 과거 XRP의 강력한 기준이었습니다. 반면에 $0.6259에 저항 수준이 있는데, 이는 가격이 돌파하는 데 어려움을 겪은 천장과 같습니다.
If XRP's price can go above $0.6259 and stay there, it might keep going up. But, if it falls below $0.5781, we could see the price go down more. The fact that XRP's price changes have become smaller lately might mean that it is getting ready to either break through the top level and go up, or fall below the bottom level and go down.
XRP의 가격이 $0.6259 이상으로 상승하고 그 상태를 유지할 수 있다면 계속 상승할 수 있습니다. 하지만 $0.5781 아래로 떨어지면 가격이 더 하락할 수 있습니다. 최근 XRP의 가격 변동폭이 작아졌다는 것은 XRP가 최고 수준을 돌파해 상승하거나, 최저 수준 아래로 떨어져 내려갈 준비를 하고 있음을 의미할 수 있습니다.
For people watching XRP, it is important to keep an eye on these two prices, $0.5781 and $0.6259. How the price behaves near these levels could tell us what might happen next.
XRP를 시청하는 사람들은 $0.5781과 $0.6259라는 두 가지 가격을 주시하는 것이 중요합니다. 이 수준 근처에서 가격이 어떻게 행동하는지 알려면 다음에 무슨 일이 일어날지 알 수 있습니다.
Dogecoin stumbles
도지코인이 비틀거린다
Dogecoin has recently stumbled at a key price level. The asset saw its price struggle to stay above $0.21639. This level has proved to be a tough spot for DOGE to pass through, and failing to hold it may lead to further dips in its price.
Dogecoin은 최근 주요 가격 수준에서 비틀거렸습니다. 해당 자산은 가격이 $0.21639 이상을 유지하는 데 어려움을 겪었습니다. 이 수준은 DOGE가 통과하기 어려운 지점임이 입증되었으며 이를 유지하지 못하면 가격이 추가로 하락할 수 있습니다.
A look at DOGE's chart reveals that it is now hovering around $0.21050, just below the resistance level that has been hard to crack. This price point is crucial because if DOGE can push past it and stay there, the coin could likely climb higher. However, if it keeps tripping below this level, there is a chance it might slip even further down to the next support at $0.16739.
DOGE의 차트를 살펴보면 현재는 깨지기 힘든 저항 수준 바로 아래인 $0.21050 부근에 맴돌고 있음을 알 수 있습니다. DOGE가 이를 뛰어넘어 그 자리에 머물면 코인이 더 오를 가능성이 높기 때문에 이 가격대는 매우 중요합니다. 그러나 이 수준 아래로 계속 하락할 경우 $0.16739의 다음 지지선까지 더욱 하락할 가능성이 있습니다.
If DOGE's price keeps going down, the next important level to watch is at $0.13581. This price could be where DOGE finds enough buyers to stop the drop and start climbing again. But for DOGE to really show growth, it will need to get back up and stay above $0.21639, which is now acting like a strong resistance level.
DOGE의 가격이 계속 하락한다면 주목해야 할 다음 중요한 수준은 $0.13581입니다. 이 가격은 DOGE가 하락을 멈추고 다시 상승을 시작할 수 있는 충분한 구매자를 찾는 곳이 될 수 있습니다. 그러나 DOGE가 실제로 성장을 보여주기 위해서는 다시 상승하여 현재 강력한 저항 수준처럼 작용하는 $0.21639 이상을 유지해야 합니다.
The future of Dogecoin's price will depend a lot on how traders feel about the market. If they see this dip in price as a chance to buy more DOGE for cheap, we could see the price rise back up.
Dogecoin 가격의 미래는 거래자가 시장에 대해 어떻게 생각하는지에 따라 크게 달라집니다. 가격 하락을 DOGE를 더 저렴하게 구매할 수 있는 기회로 본다면 가격이 다시 상승하는 것을 볼 수 있습니다.


 Crypto Daily™
 BlockchainReporter
 Optimisus
 DogeHome
 Crypto News Land
 Optimisus
 Crypto News Land
 Crypto News Land


