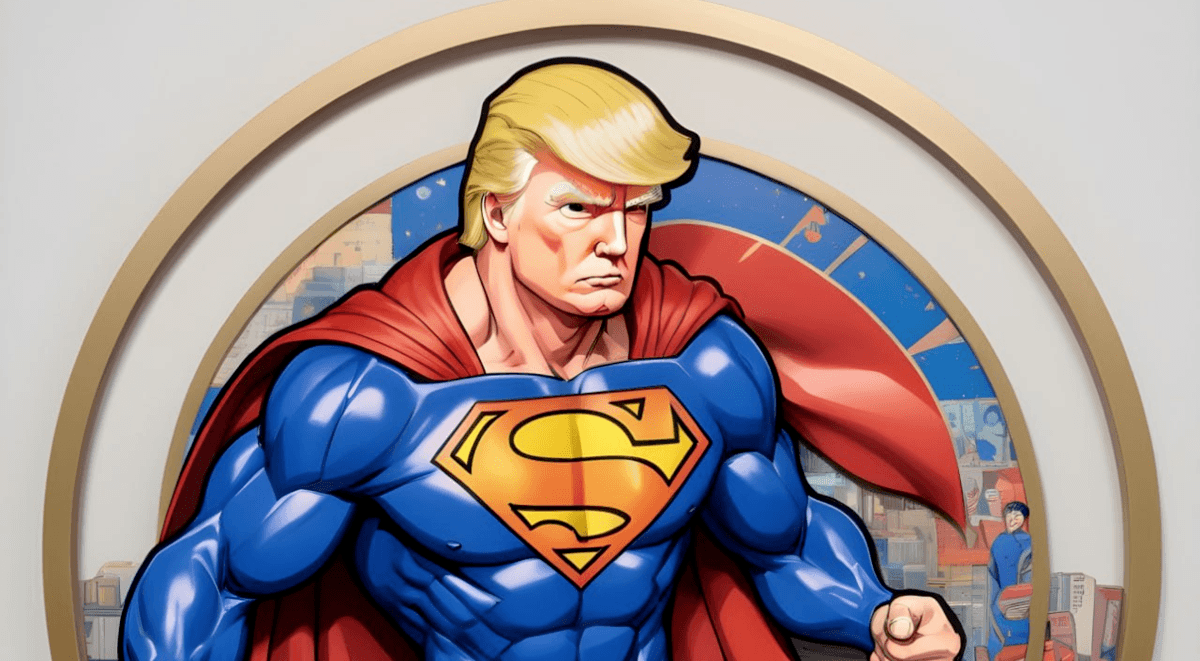
The Super Trump price has surged 28% in the past 24 hours to trade at $0.01912 as of 8:41 p.m. EST on a 12% surge in trading volume to $8.7 million.
슈퍼 트럼프 가격은 지난 24시간 동안 28% 급등해 오후 8시 41분 현재 0.01912달러에 거래되고 있습니다. EST는 거래량이 12% 급증한 870만 달러를 기록했습니다.
STRUMP has also surged 409% in the past week, according to GeckoTerminal, increasing its market capitalization to $45 million.
GeckoTerminal에 따르면 STRUMP는 지난 주에 409% 급등하여 시가총액이 4,500만 달러로 증가했습니다.
Technical Analysis
기술적 분석
The STRUMP price is encountering resistance and forming a double-top pattern, signaling a potential shift to a bearish trend. This pattern could help the bears push the price down into a corrective phase to the major support level (neckline).
STRUMP 가격은 저항에 직면해 이중 천정 패턴을 형성하고 있어 약세 추세로의 잠재적 전환을 예고하고 있습니다. 이 패턴은 하락세가 주요 지지선(네크라인)까지 조정 단계로 가격을 낮추는 데 도움이 될 수 있습니다.
Despite the dip caused by the bears, the bulls are showing resilience, bouncing back from the $0.01120 support level. However, they're facing resistance around $0.02407, allowing the bears to push the price down.
약세로 인한 하락에도 불구하고 강세는 $0.01120 지지 수준에서 반등하는 회복력을 보이고 있습니다. 그러나 그들은 $0.02407 부근의 저항에 직면해 있어 하락세가 가격을 낮출 수 있습니다.
Technical indicators are looking bullish. The price currently trades above the 21 and 50 Simple Moving Average (SMA), supporting the upward trend and boosting market sentiment. This allows the bulls to push the price towards the 200 SMA.
기술적 지표는 낙관적으로 보입니다. 현재 가격은 단순 이동 평균(SMA) 21 및 50 위에서 거래되고 있어 상승 추세를 뒷받침하고 시장 심리를 강화하고 있습니다. 이를 통해 황소는 가격을 200 SMA 방향으로 끌어올릴 수 있습니다.
Moreover, the MACD has entered bullish territory, with the blue line crossing above the orange line, showing positive momentum. The histogram bars are also positive, adding to the bullish sentiment.
더욱이 MACD는 파란색 선이 주황색 선 위로 교차하는 등 상승세 영역에 진입하여 긍정적인 모멘텀을 보여주고 있습니다. 히스토그램 막대도 긍정적이어서 낙관적인 분위기를 더해줍니다.
The Relative Strength Index (RSI) indicates indecisiveness in the STRUMP market, hovering around the neutral level of 50, suggesting neither the bulls nor the bears are in control. Similarly, the Awesome Oscillator (AO) is flashing green but remains in negative territory, reinforcing this uncertainty.
상대강도지수(RSI)는 STRUMP 시장의 우유부단함을 나타내며 중립 수준인 50 주변을 맴돌며 상승세나 하락세 모두 통제할 수 없음을 나타냅니다. 마찬가지로 AO(Awesome Oscillator)는 녹색으로 깜박이지만 마이너스 영역에 남아 있어 이러한 불확실성을 강화합니다.
Trading Strategy
거래 전략
The bulls are considering a bounce back on the 21 simple moving average, which is acting as immediate support for the price. Specifically, the Super Trump price needs to close above $0.02407 before the token becomes an attractive buy again.
강세론자들은 가격에 대한 즉각적인 지지 역할을 하는 21 단순 이동 평균의 반등을 고려하고 있습니다. 특히 토큰이 다시 매력적인 구매가 되려면 슈퍼 트럼프 가격이 $0.02407 이상으로 마감되어야 합니다.
If this happens, the resulting buying pressure could push the token higher, continuing the upward trend. This could drive the Super Trump price to reclaim the $0.04345 high.
이런 일이 발생하면 그에 따른 구매 압력으로 인해 토큰이 더 높아져 상승 추세가 지속될 수 있습니다. 이로 인해 슈퍼 트럼프 가격이 $0.04345 최고치를 회복할 수 있습니다.
However, if the bears continue to act on the presence of the double bottom pattern, they could force the price down to $0.01509 in the support zone, coinciding with 21 SMA.
그러나 하락세가 이중 바닥 패턴의 존재에 따라 계속 행동한다면 21 SMA에 맞춰 지지대에서 가격을 $0.01509로 낮출 수 있습니다.
A close below this level in the four-hour timeframe could trigger more sell orders, potentially driving the price to the market range's bottom at $0.01132.
4시간 내에 이 수준 아래로 종가가 형성되면 더 많은 매도 주문이 촉발되어 잠재적으로 가격이 $0.01132의 시장 범위 바닥까지 떨어질 수 있습니다.


 CoinPedia News
 CoinoMedia
 Optimisus
 CFN
CFN CFN
CFN The Crypto Times
 Cryptopolitan_News
 Crypto News Land
 CryptoNewsLand


