

Bitcoin (BTC) bulls attempted to push the price above $85,000, but were ultimately met with resistance from bears. On a positive note, larger investors appear to be accumulating at lower price points. Santiment, a research firm, reported on X that wallets holding 10 BTC or more have acquired approximately 5,000 Bitcoin since March 3rd. They suggest that continued buying by large players could lead to a stronger second half of March compared to recent performance.
However, not all analysts share this bullish near-term outlook. Arthur Hayes, BitMEX co-founder and Maelstrom CIO, posted on X that Bitcoin could retest $78,000, potentially even falling below $75,000. He warned of potentially volatile price action should the price drop within the $70,000 to $75,000 range, due to significant open interest concentrated there.
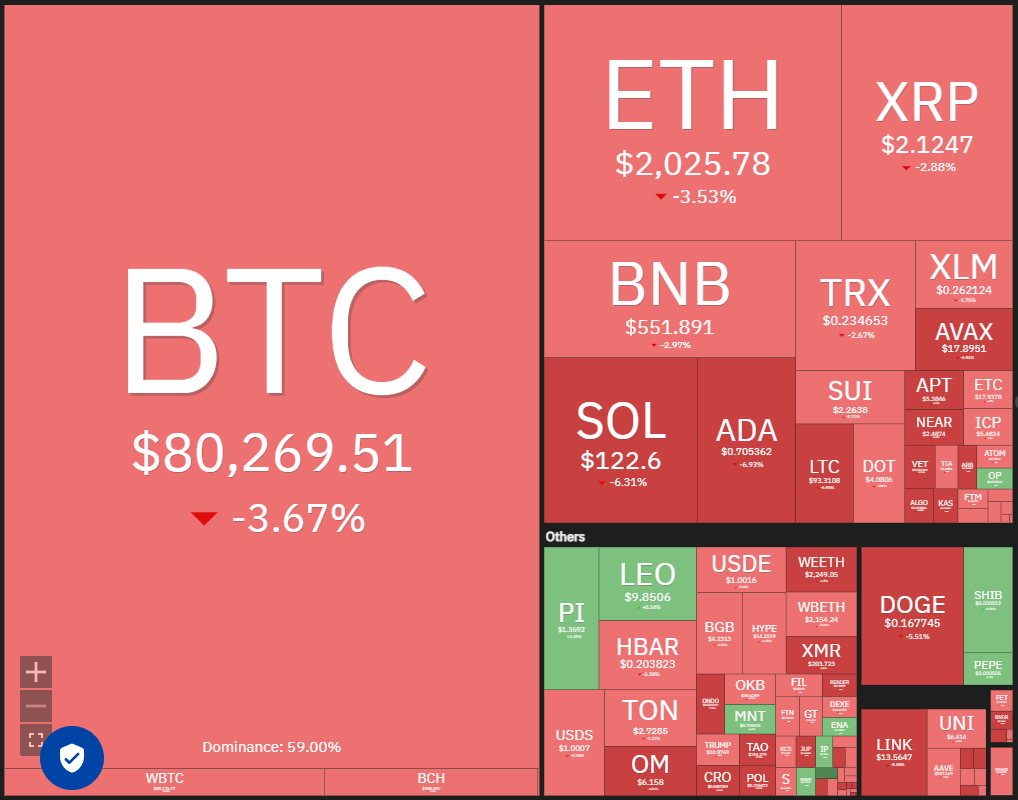
Short-term investor sentiment remains bearish. CoinShares data reveals $876 million in outflows from cryptocurrency exchange-traded products (ETPs) last week, bringing the four-week total to $4.75 billion. Bitcoin ETPs accounted for the majority of these outflows, at $756 million.
Can Bitcoin initiate a recovery from current levels, subsequently lifting altcoins? Let's analyze the charts.
S&P 500 Index Price Analysis
The S&P 500 Index (SPX) reversed course from its 20-day exponential moving average (5,900) on March 3rd and broke below the 5,773 support level on March 6th, completing a double-top pattern.
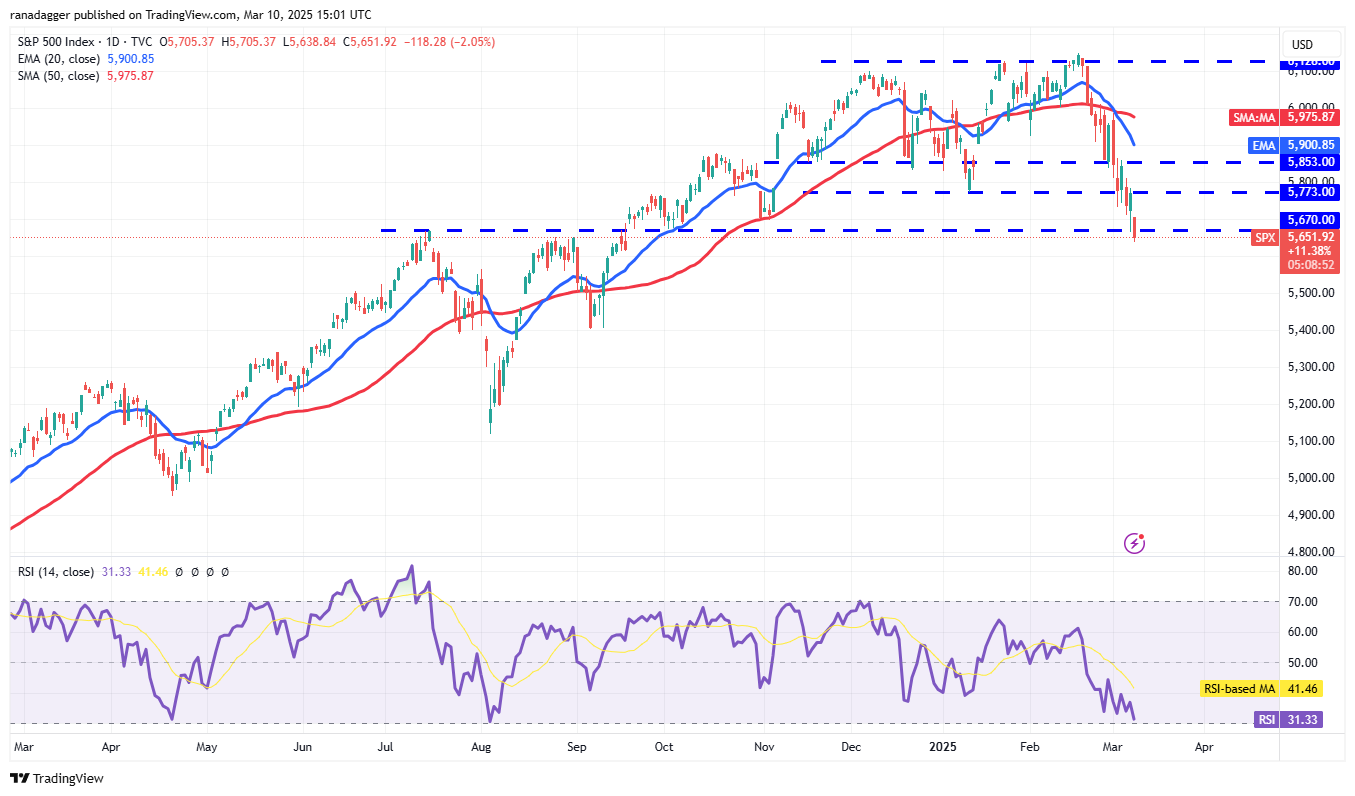
The index rebounded from 5,670 on March 7th, but bears successfully defended the 5,773 breakdown level. A subsequent decline broke below the 5,670 support on March 10th, paving the way for a potential drop to 5,400. Sustained price action above 5,773 would signal robust demand, potentially leading to a rise towards the 20-day EMA, which is anticipated to provide strong resistance.
US Dollar Index Price Analysis
The US Dollar Index (DXY) experienced a sharp decline starting March 3rd, breaking below the 105.42 support on March 5th.
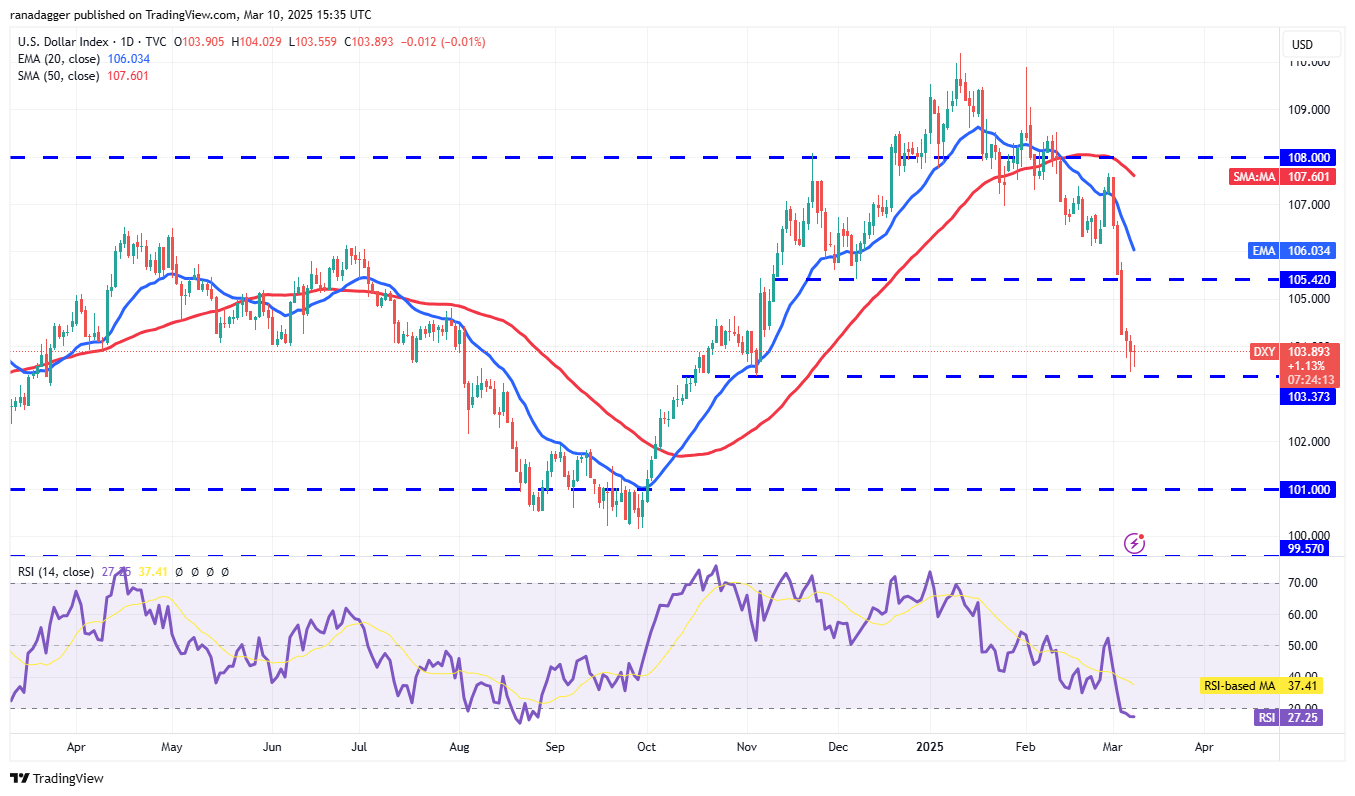
This break below 105.42 suggests the prior breakout above 108 may have been a bull trap. While buyers are attempting to defend the 103.73 level, any relief rally is expected to encounter selling pressure at the 20-day EMA (106.03). A reversal from the current level or the 20-day EMA would indicate negative sentiment, increasing the risk of a break below 103.37 and a potential plunge to 101. Sustained price action above the 20-day EMA would be needed to pave the way for a rally to 108.
Bitcoin Price Analysis
BTC broke below the symmetrical triangle pattern's support line on March 9th, signaling seller dominance.
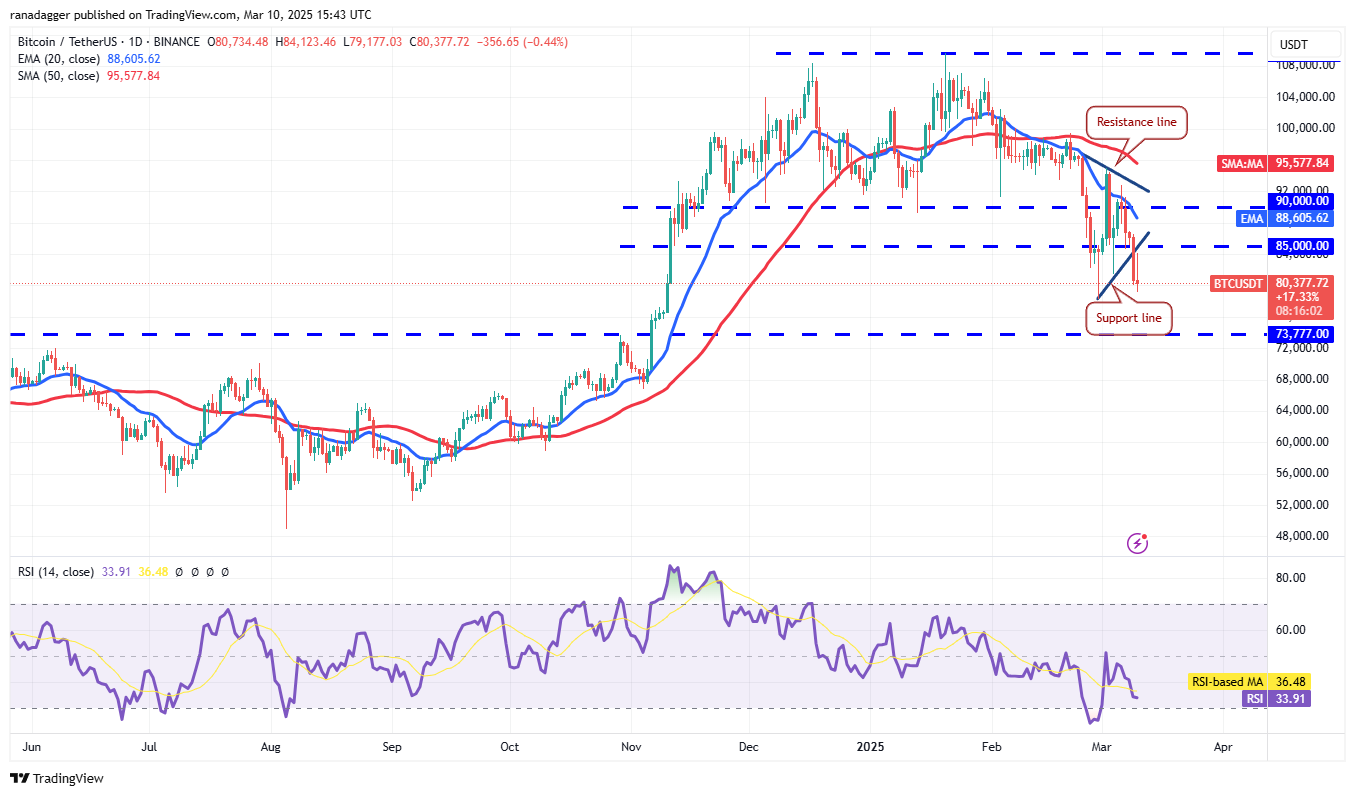
Bulls are attempting to defend the $81,500 to $78,258 support zone, but a recovery attempt faced selling pressure at the breakdown level on March 10th. This suggests bears are attempting to transform the support line into resistance. A break below $78,258 could lead to a decline to $73,777. Conversely, a successful defense of the support zone and a move above the 20-day EMA ($88,605) could lead to a rally towards the resistance line.
Ether Price Analysis
Ether (ETH) closed below the crucial $2,111 support on March 9th, signaling a continuation of the downtrend.
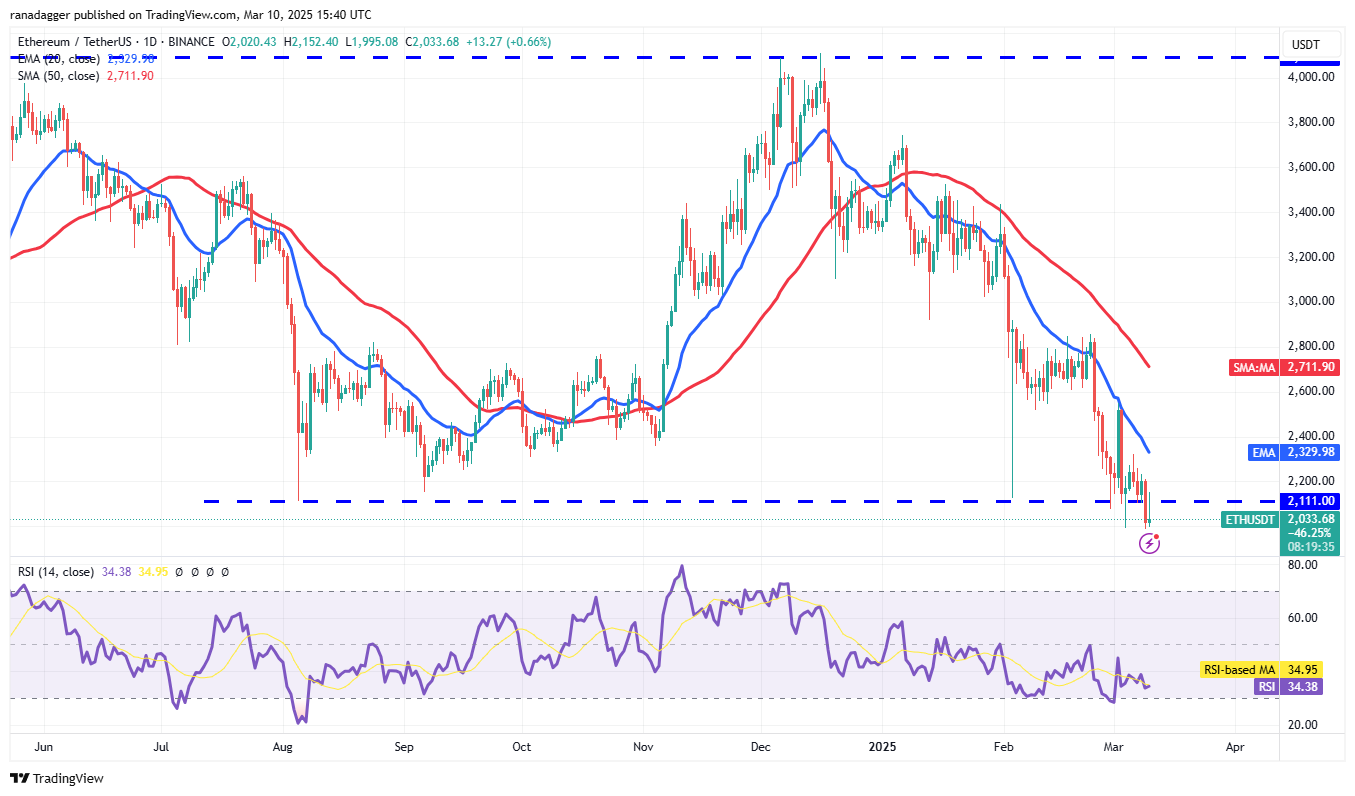
While buyers attempted to push the price above $2,111 on March 10th, a long candlestick wick indicates strong selling pressure. Minor support exists at $1,993, but a break below this level could lead to a decline to $1,750 and potentially $1,550. Sustained price action above the 20-day EMA ($2,329) would be needed to suggest the break below $2,111 was a bear trap, potentially leading to a rally towards the 50-day SMA ($2,711).
XRP Price Analysis
XRP (XRP) continues its decline towards the crucial $2 support, indicating potential bear market control.
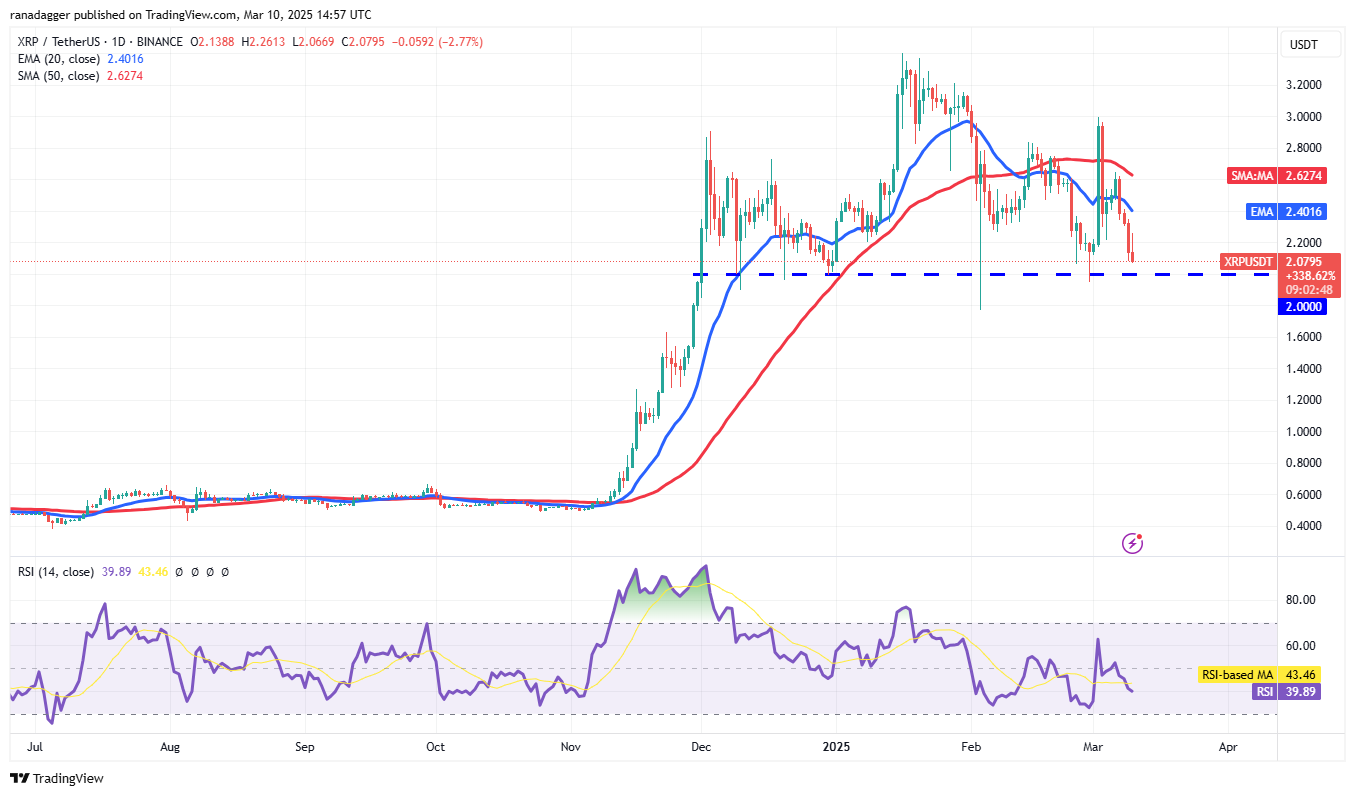
A break and close below $2 would complete a bearish head-and-shoulders pattern. While minor support exists at $1.77, a break below this level could lead to a decline towards $1.28. Conversely, a strong bounce off $2 would signal strong buyer support. The 20-day EMA ($2.40) is likely to act as resistance, but a break above could lead to a rise to $2.80.
BNB Price Analysis
BNB's (BNB) failure to surpass the 20-day EMA ($601) triggered further selling on March 9th, pushing the price below $546.
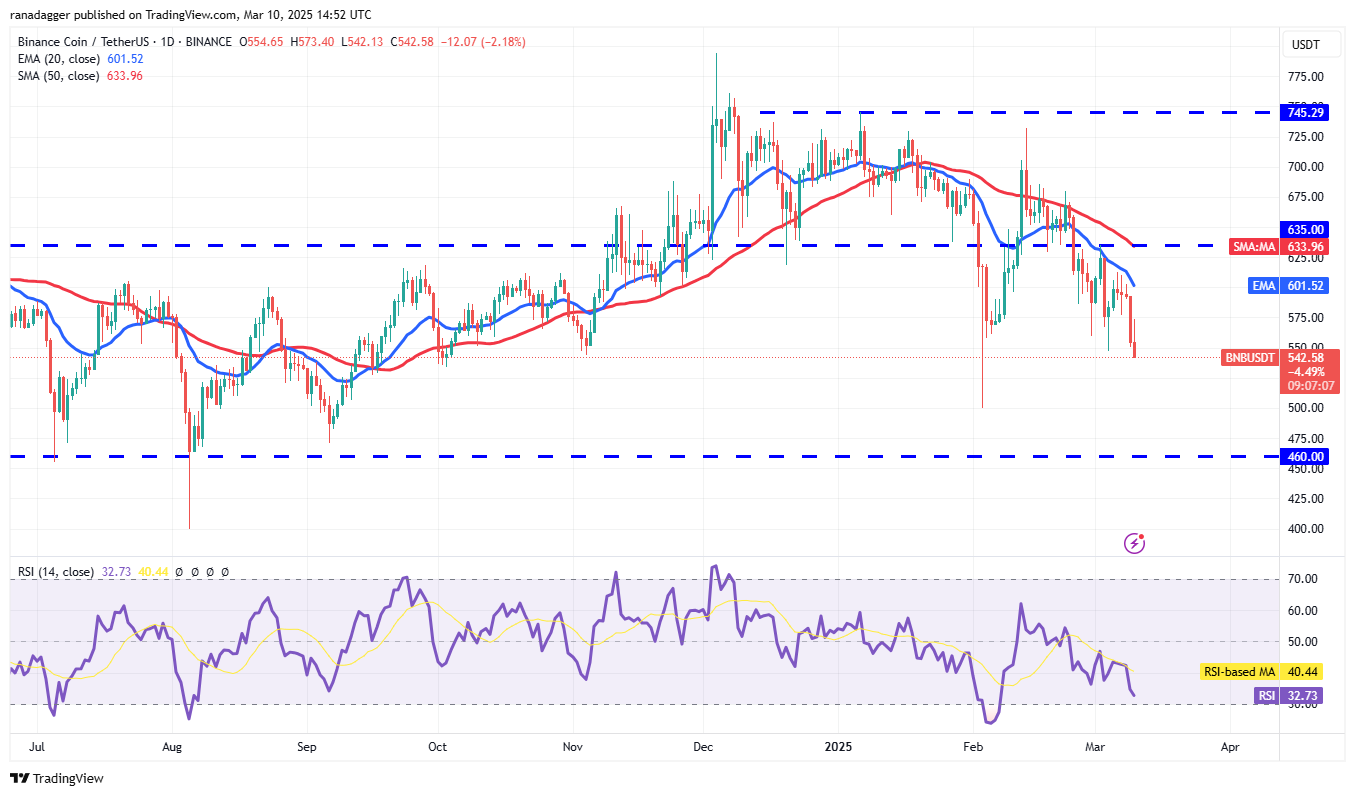
Downward-sloping moving averages and a relative strength index (RSI) in negative territory suggest a bearish trend. Sustained price action below $546 could lead to a decline to $500, with buyers expected to defend the $500-$460 zone. A break above the 20-day EMA would be needed to initiate a potential rise towards the 50-day SMA ($633), a close above which would signal a short-term trend reversal.
Solana Price Analysis
Solana (SOL) broke below its uptrend line on March 9th, reaching the strong support zone between $120 and $110.
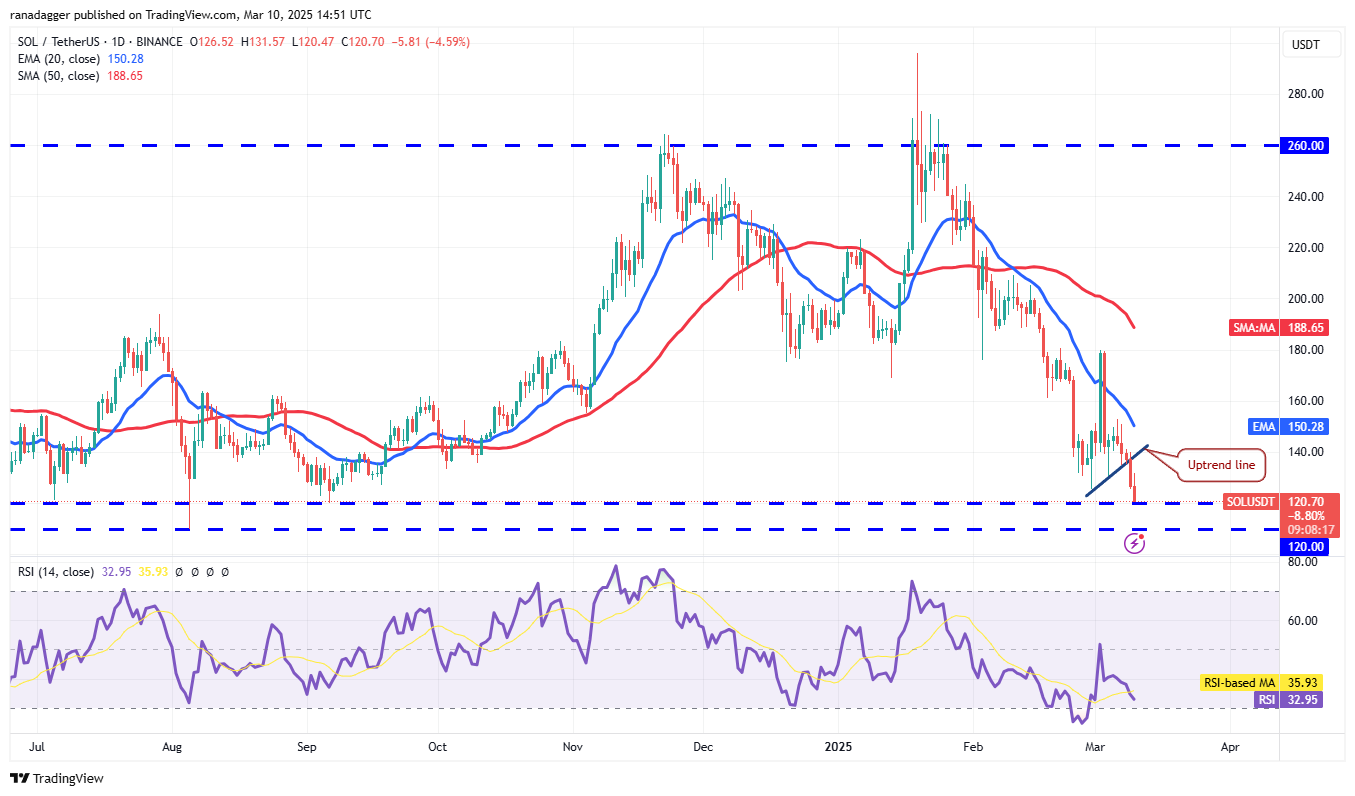
While bulls are expected to defend this support zone, any relief rally could encounter selling pressure at the 20-day EMA ($150). A sharp decline from the 20-day EMA could risk a break below $110, leading to a potential decline to $100 and further to $80. Conversely, a rise above the 20-day EMA would signal strong buying, potentially leading to a climb towards the 50-day SMA ($188).
Dogecoin Price Analysis
Dogecoin (DOGE) fell below the $0.18 support on March 9th, indicating a resumption of the downtrend.
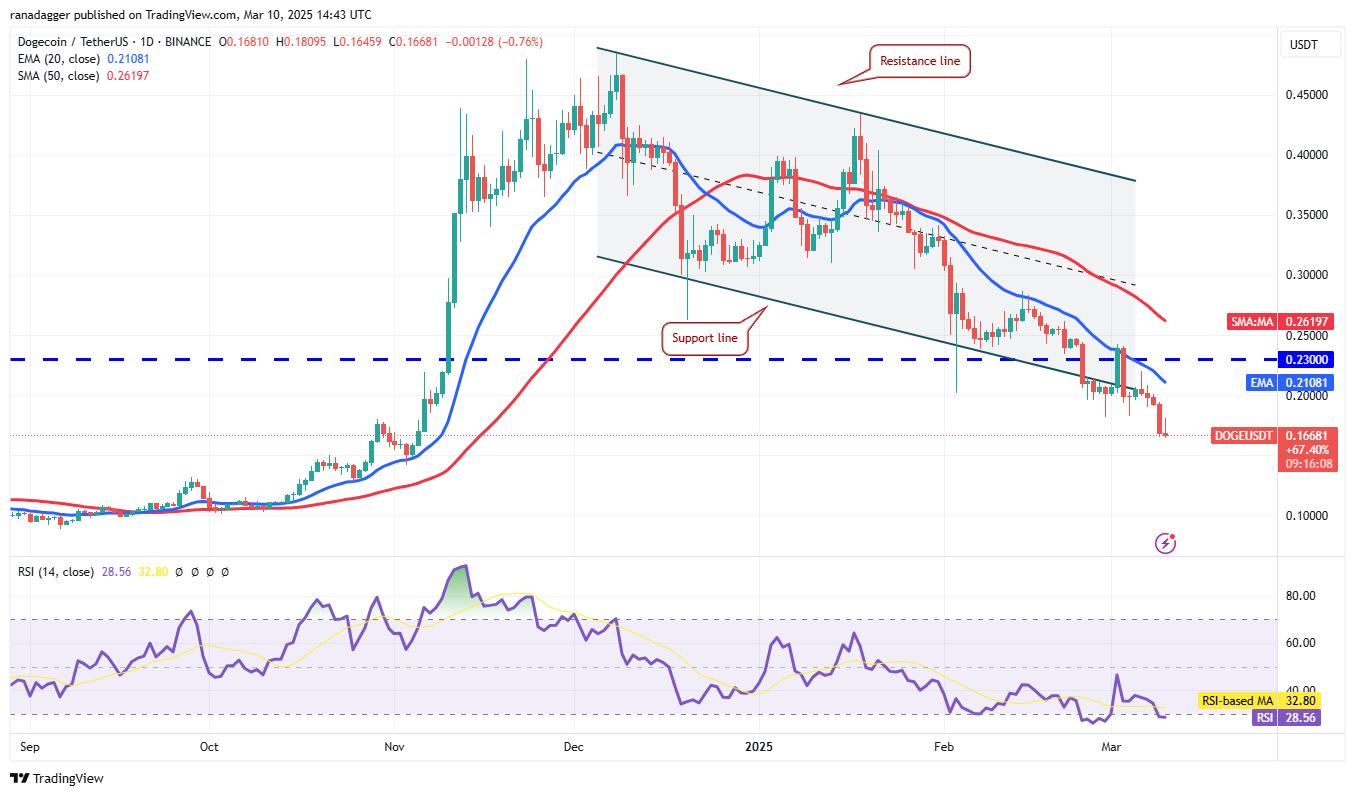
Downward-sloping moving averages and an RSI in oversold territory suggest bear market dominance. The 20-day EMA ($0.21) is a key resistance level. A sharp decline from this EMA could lead to a drop to $0.14. A break and close above the 20-day EMA would signal easing selling pressure, potentially leading to a rise towards the 50-day SMA ($0.26), which could also act as resistance.
Cardano Price Analysis
Cardano (ADA) fell below its moving averages on March 8th, indicating strong selling pressure.
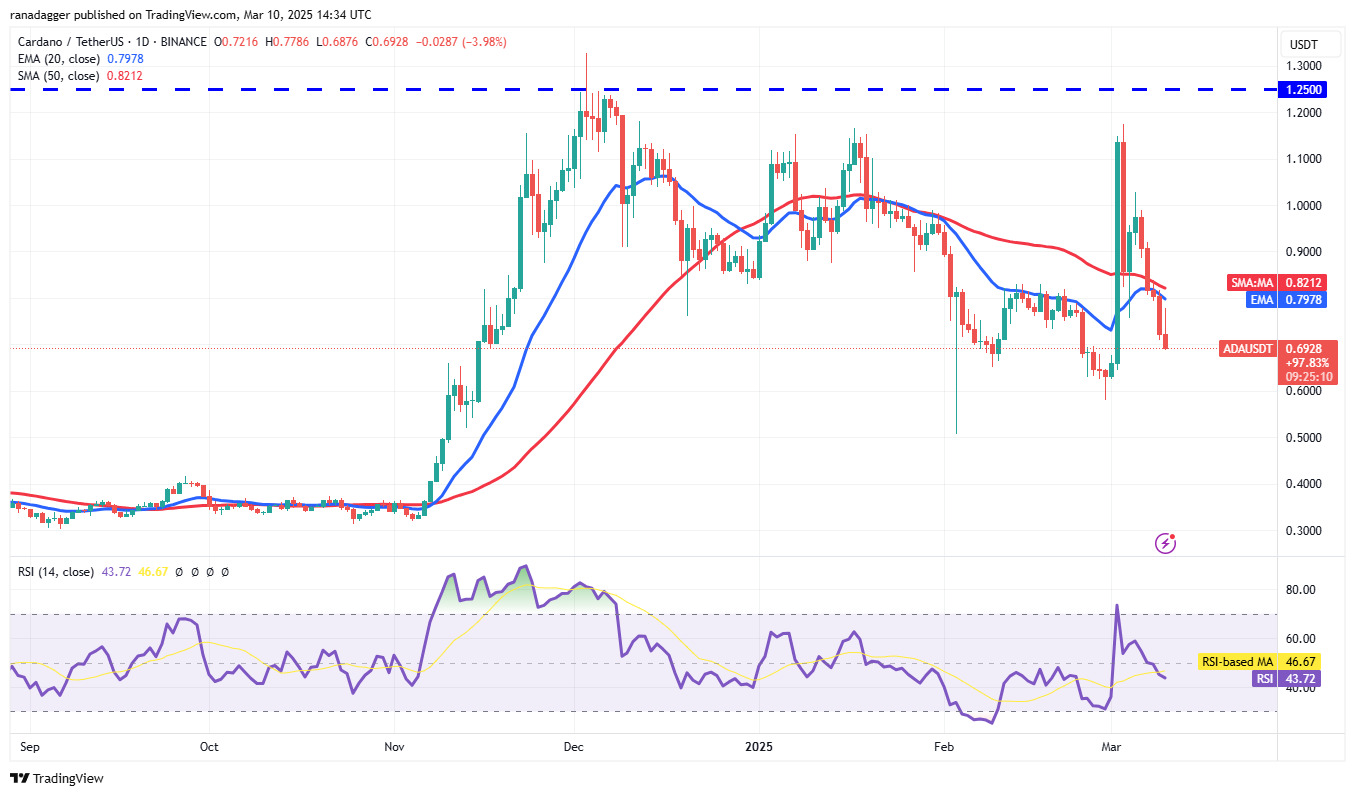
Downward-sloping moving averages and an RSI in negative territory suggest a slight bearish edge. Support levels exist at $0.58 and $0.50. Any relief rally is likely to face selling pressure at the moving averages. Sustained price action above the moving averages would be needed to signal a potential recovery, potentially leading to a rise towards $1.02.
Pi Price Analysis
Pi (PI) fell to the 61.8% Fibonacci retracement level of $1.20 on March 9th, indicating continued bear pressure.
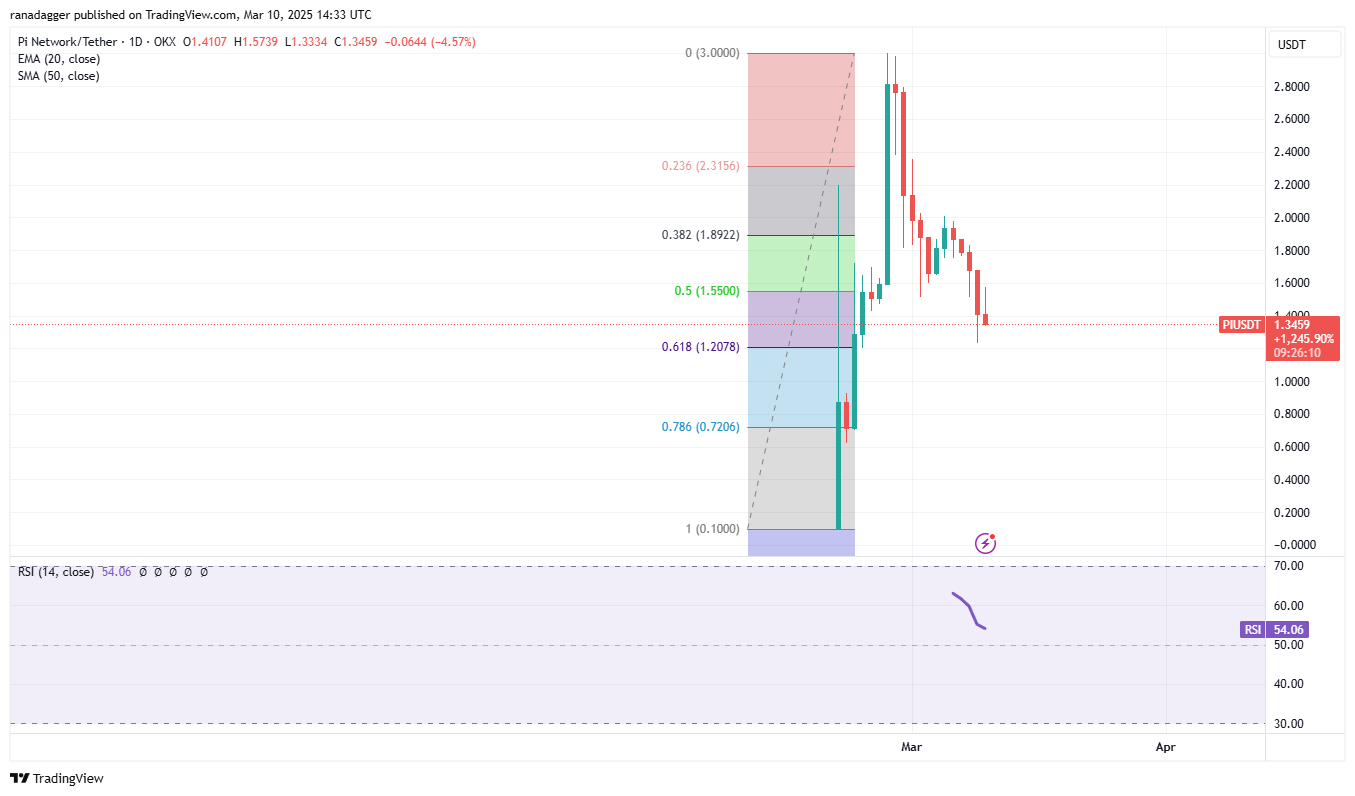
Buyers are attempting a recovery, but a long wick on the March 10th candlestick shows selling at higher levels. This increases the risk of a break below $1.20, potentially leading to a decline to the 78.6% retracement level of $0.72. To prevent further downside, bulls need to quickly push the price above the $2 resistance level, which would suggest the correction may be over.
Disclaimer: This article does not provide investment advice or recommendations. All investment and trading decisions involve risk, and readers should conduct their own thorough research before making any decisions.
 U_Today
 U_Today
 Optimisus
 Crypto Front News
 DogeHome
 Cointribune
 CoinPedia News
 CoinoMedia
 CoinEagle.com


