

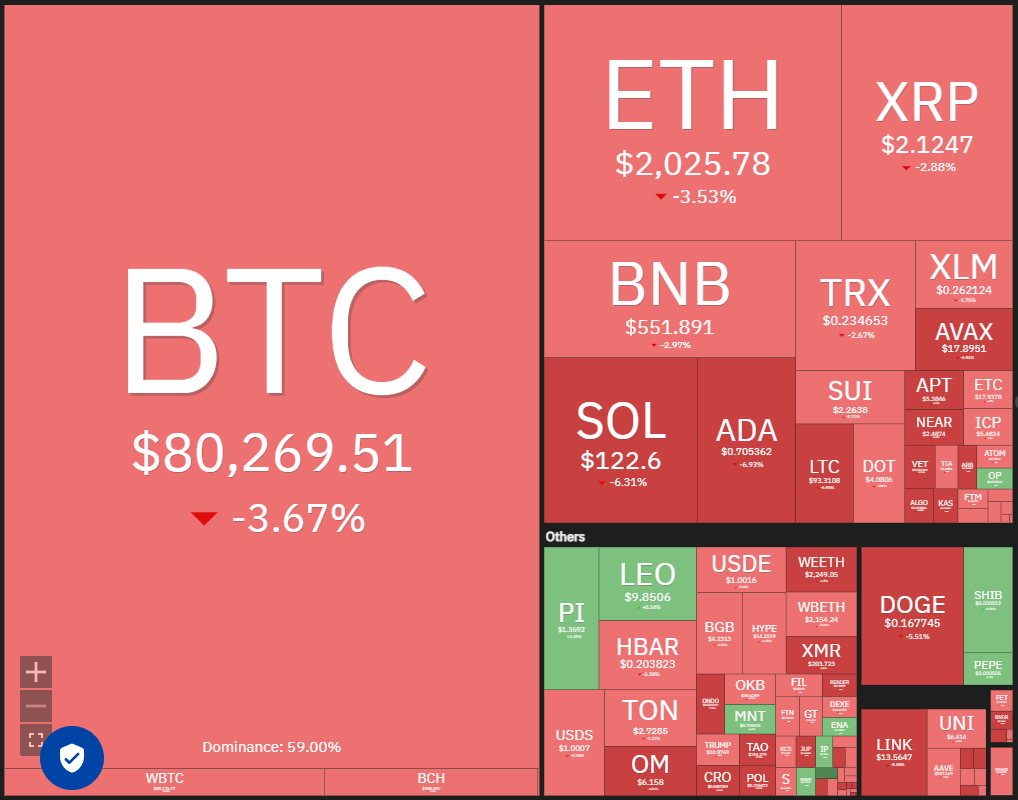
Bitcoin (BTC) bulls attempted to push the price above $85,000, but were ultimately met with resistance from bears. On a positive note, larger investors appear to be accumulating at lower price points. Santiment, a research firm, reported on X that wallets holding 10 BTC or more have acquired approximately 5,000 Bitcoin since March 3rd. They suggest that continued buying by large players could lead to a stronger second half of March compared to recent performance.
比特币(BTC)公牛试图将价格推高超过85,000美元,但最终遇到了熊的抵抗。 从积极的角度来看,较大的投资者似乎以较低的价格积累。 Santiment是一家研究公司,他在X上报道说,自3月3日以来,持有10 BTC或更多的钱包已经收购了约5,000个比特币。 他们认为,与最近的表现相比,大型球员继续购买可能导致3月下半年的强劲增长。
However, not all analysts share this bullish near-term outlook. Arthur Hayes, BitMEX co-founder and Maelstrom CIO, posted on X that Bitcoin could retest $78,000, potentially even falling below $75,000. He warned of potentially volatile price action should the price drop within the $70,000 to $75,000 range, due to significant open interest concentrated there.
但是,并非所有分析师都分享了这个看涨的近期前景。 Bitmex联合创始人和Maelstrom CIO的Arthur Hayes在X上发布,比特币可能会重新估算78,000美元,甚至可能低于75,000美元。他警告说,由于大量的开放利息集中在那里,如果价格下降到70,000美元至75,000美元之间,则可能会发生波动的价格行动。
Short-term investor sentiment remains bearish. CoinShares data reveals $876 million in outflows from cryptocurrency exchange-traded products (ETPs) last week, bringing the four-week total to $4.75 billion. Bitcoin ETPs accounted for the majority of these outflows, at $756 million.
短期投资者的情绪仍然是看跌。 Coinshares的数据显示,上周来自加密货币交易所交易产品(ETP)的8.76亿美元流出,使四周的总计达到47.5亿美元。 比特币ETP占此类流出的大部分,为7.56亿美元。
Can Bitcoin initiate a recovery from current levels, subsequently lifting altcoins? Let's analyze the charts.
比特币可以从当前水平启动恢复,然后提升山寨币吗?让我们分析图表。
S&P 500 Index Price Analysis
标准普尔500指数分析
The S&P 500 Index (SPX) reversed course from its 20-day exponential moving average (5,900) on March 3rd and broke below the 5,773 support level on March 6th, completing a double-top pattern.
标准普尔500指数(SPX)从3月3日的20天指数移动平均线(5,900)扭转了课程,并在3月6日的5,773支持水平中损失了,完成了双顶模式。
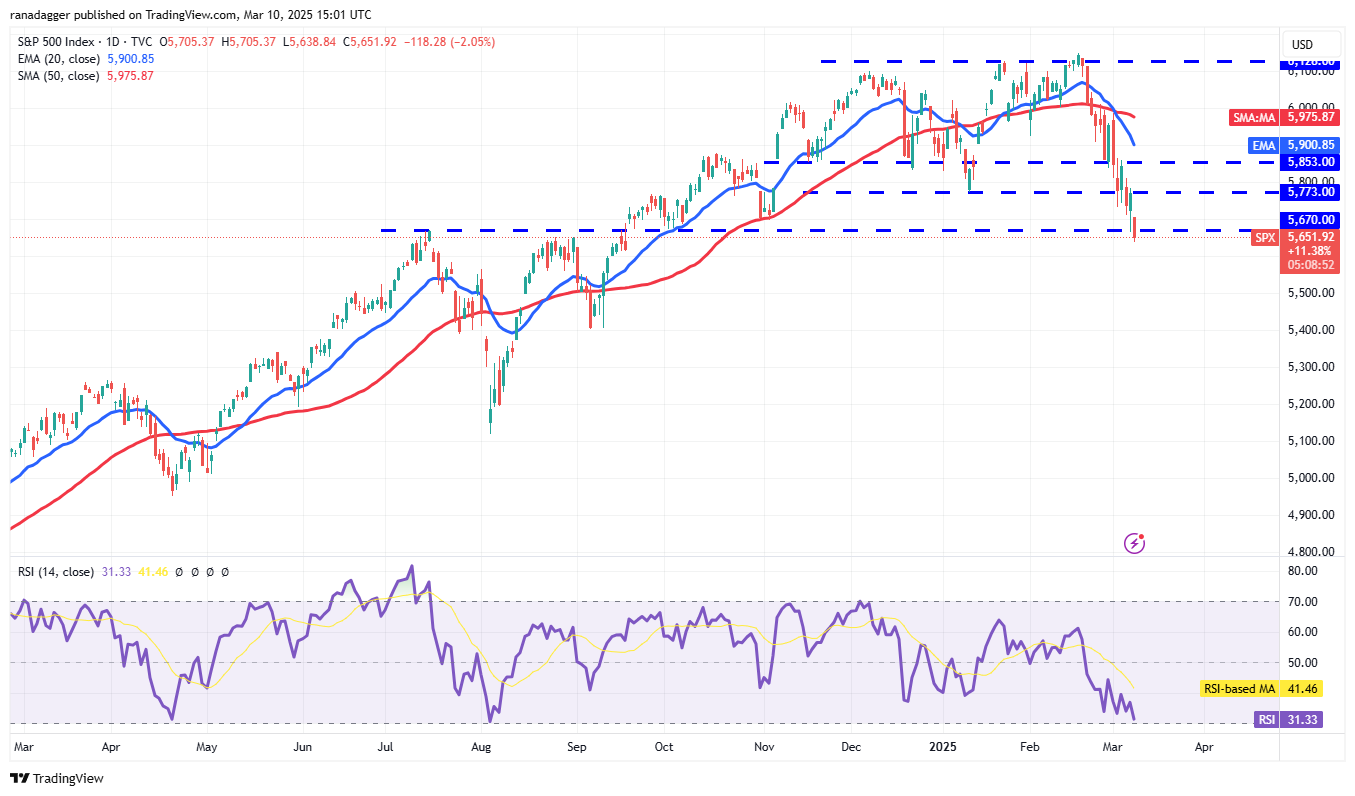
The index rebounded from 5,670 on March 7th, but bears successfully defended the 5,773 breakdown level. A subsequent decline broke below the 5,670 support on March 10th, paving the way for a potential drop to 5,400. Sustained price action above 5,773 would signal robust demand, potentially leading to a rise towards the 20-day EMA, which is anticipated to provide strong resistance.
该指数从3月7日的5,670反弹,但Bears成功捍卫了5,773次故障水平。 随后的下降幅度低于3月10日的5,670支支持,为潜在的下降到5,400。 持续的价格行动高于5,773,这表明需求强劲,可能会导致20天EMA的上升,预计将提供强烈的抵抗力。
US Dollar Index Price Analysis
美元索引价格分析
The US Dollar Index (DXY) experienced a sharp decline starting March 3rd, breaking below the 105.42 support on March 5th.
从3月3日开始,美元指数(DXY)的下降幅度急剧下降,在3月5日的105.42支持下跌幅低于105.42的支持。
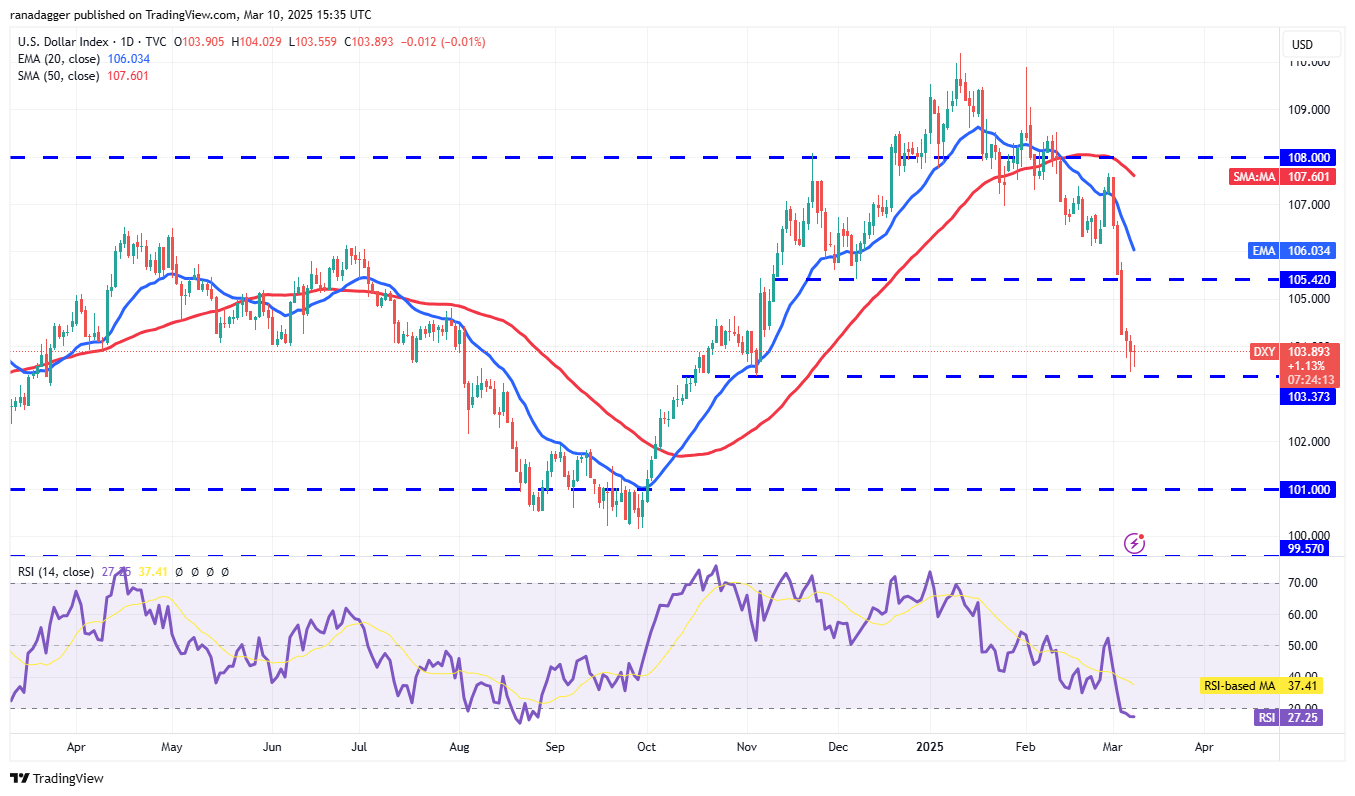
This break below 105.42 suggests the prior breakout above 108 may have been a bull trap. While buyers are attempting to defend the 103.73 level, any relief rally is expected to encounter selling pressure at the 20-day EMA (106.03). A reversal from the current level or the 20-day EMA would indicate negative sentiment, increasing the risk of a break below 103.37 and a potential plunge to 101. Sustained price action above the 20-day EMA would be needed to pave the way for a rally to 108.
低于105.42的突破表明,超过108的先前突破可能是牛陷阱。 尽管买家试图捍卫103.73水平,但预计任何救济集会都会在20天EMA(106.03)遇到压力。 从当前水平或20天的EMA逆转将表明负面情绪,将休息的风险提高到103.37以下,潜在的暴跌到101。持续的价格行动超过20天EMA,将需要为集会铺平道路至108。
Bitcoin Price Analysis
比特币价格分析
BTC broke below the symmetrical triangle pattern's support line on March 9th, signaling seller dominance.
BTC在3月9日在对称三角形模式的支撑线下方打破了卖方的统治地位。
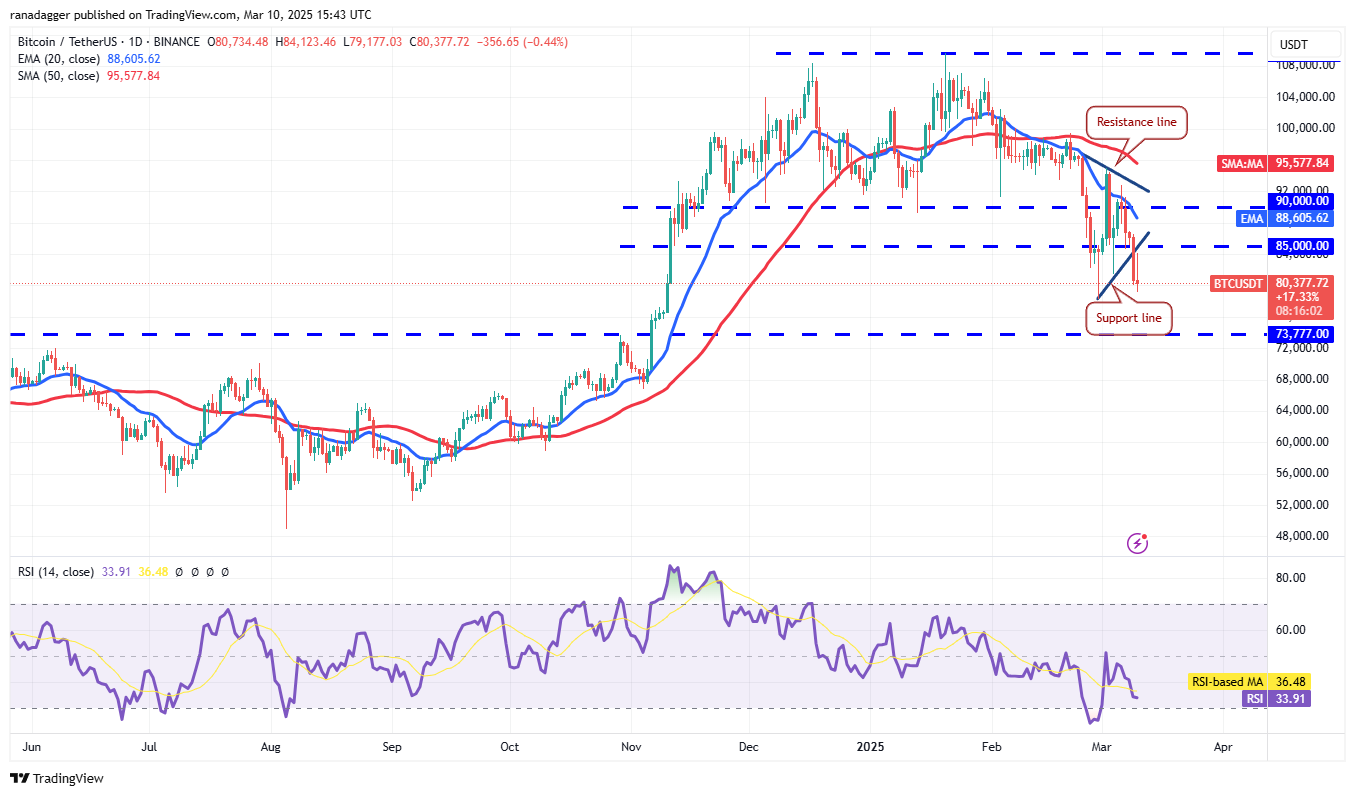
Bulls are attempting to defend the $81,500 to $78,258 support zone, but a recovery attempt faced selling pressure at the breakdown level on March 10th. This suggests bears are attempting to transform the support line into resistance. A break below $78,258 could lead to a decline to $73,777. Conversely, a successful defense of the support zone and a move above the 20-day EMA ($88,605) could lead to a rally towards the resistance line.
公牛队正试图捍卫81,500美元至78,258美元的支持区,但恢复企图在3月10日的故障级别面临销售压力。 这表明熊试图将支撑线转变为电阻。 低于$ 78,258的休息可能会导致下降至73,777美元。 相反,对支撑区的成功辩护以及超过20天EMA(88,605美元)的迁移可能会导致向电阻线的集会。
Ether Price Analysis
以太价格分析
Ether (ETH) closed below the crucial $2,111 support on March 9th, signaling a continuation of the downtrend.
Ether(ETH)在3月9日至关重要的2,111美元支持下关闭,这表明下降趋势的延续。
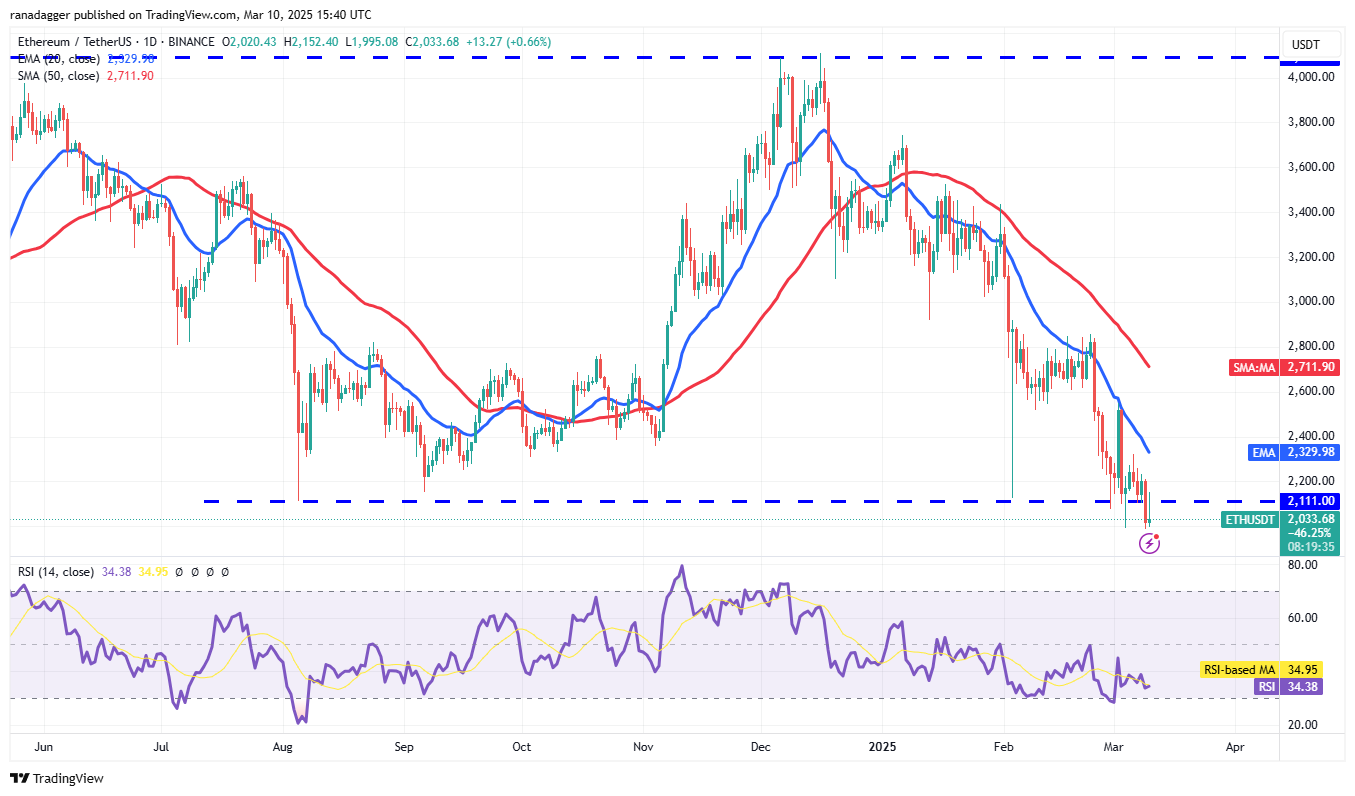
While buyers attempted to push the price above $2,111 on March 10th, a long candlestick wick indicates strong selling pressure. Minor support exists at $1,993, but a break below this level could lead to a decline to $1,750 and potentially $1,550. Sustained price action above the 20-day EMA ($2,329) would be needed to suggest the break below $2,111 was a bear trap, potentially leading to a rally towards the 50-day SMA ($2,711).
尽管买家试图在3月10日将价格提高到2,111美元以上,但长长的烛台wick表明销售压力很大。 较小的支持的存在为1,993美元,但低于此水平的休息可能会导致下降至1,750美元,并可能为1,550美元。 需要持续的价格行动以高于20天的EMA(2,329美元),以表明低于2,111美元的休息时间是一个熊陷阱,有可能导致向50天SMA($ 2,711)集会。
XRP Price Analysis
XRP价格分析
XRP (XRP) continues its decline towards the crucial $2 support, indicating potential bear market control.
XRP(XRP)继续下降到至关重要的2美元支持下,表明潜在的熊市控制。
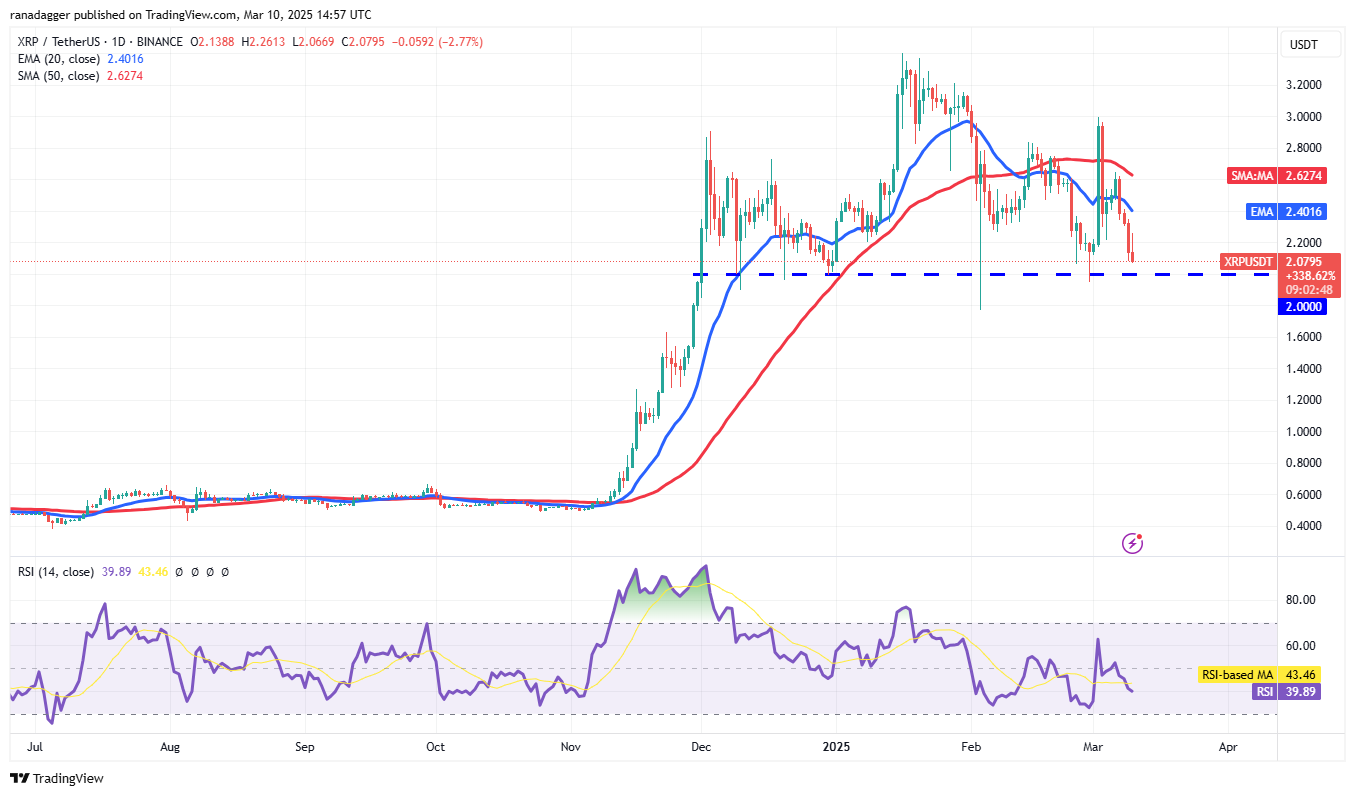
A break and close below $2 would complete a bearish head-and-shoulders pattern. While minor support exists at $1.77, a break below this level could lead to a decline towards $1.28. Conversely, a strong bounce off $2 would signal strong buyer support. The 20-day EMA ($2.40) is likely to act as resistance, but a break above could lead to a rise to $2.80.
休息时间低于2美元以下,将完成看跌的头和露肩图案。 尽管次要支持的价格为1.77美元,但低于此水平的休息可能会导致下降到1.28美元。 相反,强劲的反弹2美元将表示强大的买家支持。 20天的EMA(2.40美元)可能充当阻力,但上面的突破可能会导致$ 2.80。
BNB Price Analysis
BNB价格分析
BNB's (BNB) failure to surpass the 20-day EMA ($601) triggered further selling on March 9th, pushing the price below $546.
BNB的(BNB)未能超过20天EMA(601美元),于3月9日触发了进一步的销售,将价格推高低于546美元。
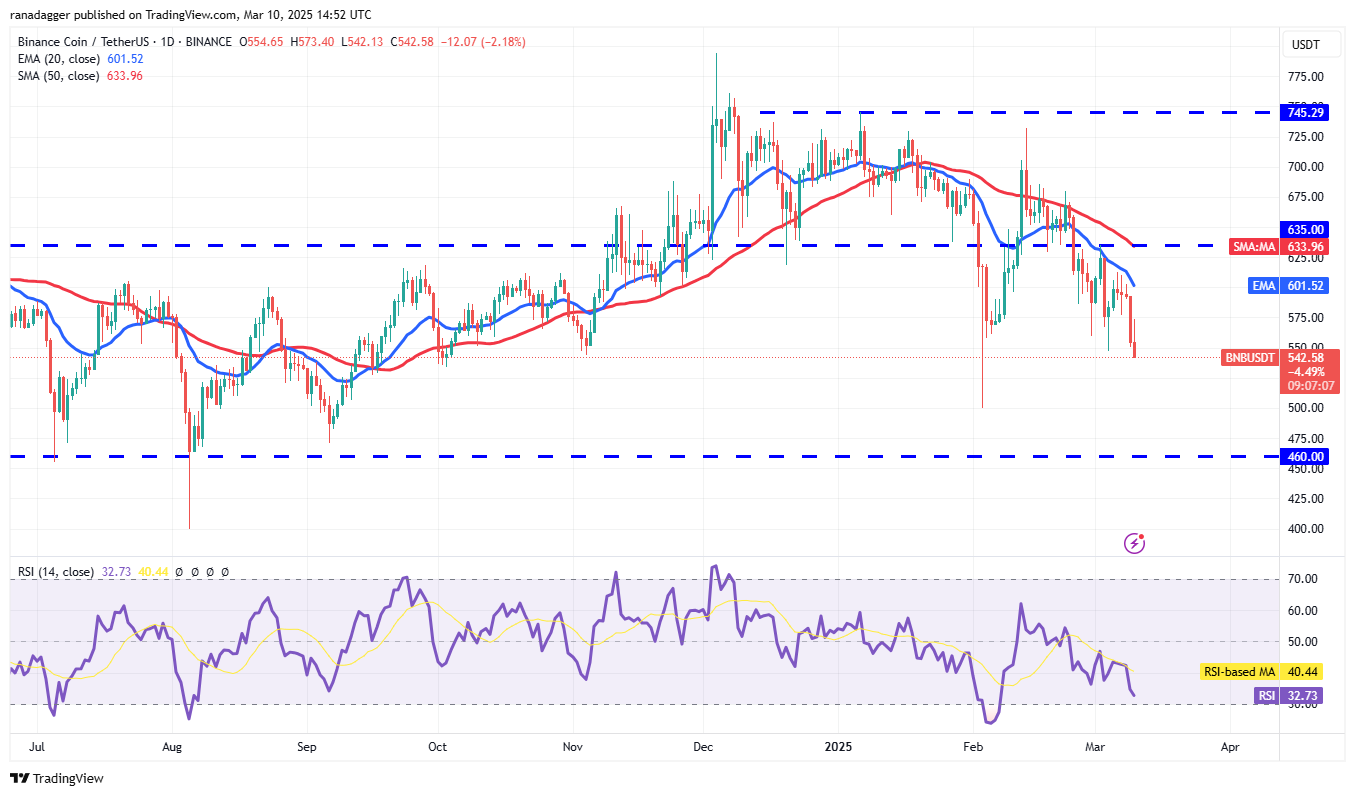
Downward-sloping moving averages and a relative strength index (RSI) in negative territory suggest a bearish trend. Sustained price action below $546 could lead to a decline to $500, with buyers expected to defend the $500-$460 zone. A break above the 20-day EMA would be needed to initiate a potential rise towards the 50-day SMA ($633), a close above which would signal a short-term trend reversal.
在负区域中向下移动的移动平均值和相对强度指数(RSI)表明看跌趋势。 低于546美元的持续价格行动可能会导致下降至500美元,预计买家将为$ 500- $ 460的区域辩护。 需要超过20天EMA的休息时间,以使50天SMA的潜在上升(633美元)上升,这将表明短期趋势逆转。
Solana Price Analysis
Solana价格分析
Solana (SOL) broke below its uptrend line on March 9th, reaching the strong support zone between $120 and $110.
Solana(Sol)于3月9日在其上升趋势线以下打破,达到了120美元至110美元之间的强大支持区。
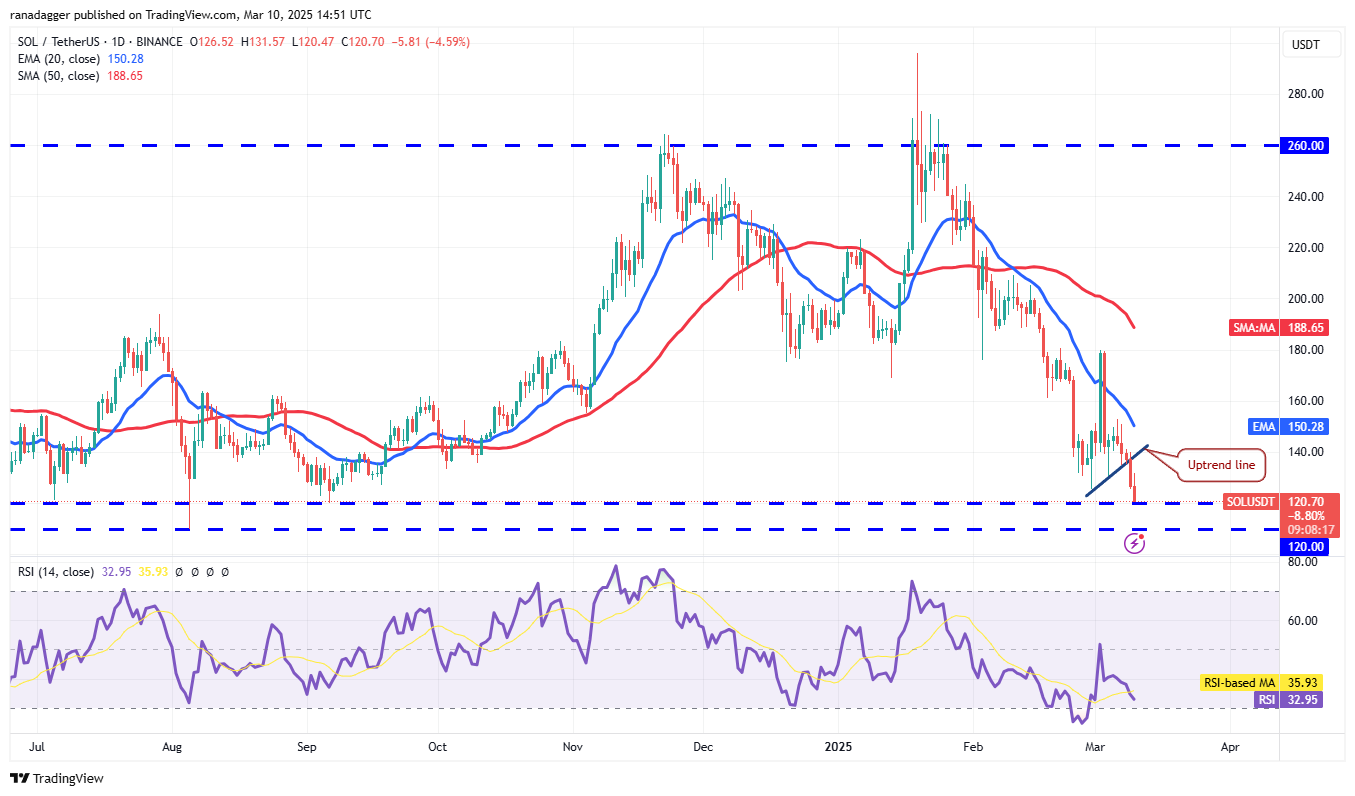
While bulls are expected to defend this support zone, any relief rally could encounter selling pressure at the 20-day EMA ($150). A sharp decline from the 20-day EMA could risk a break below $110, leading to a potential decline to $100 and further to $80. Conversely, a rise above the 20-day EMA would signal strong buying, potentially leading to a climb towards the 50-day SMA ($188).
尽管预计公牛会捍卫这个支持区,但任何救济集会都可能在20天EMA(150美元)的情况下遇到压力。 与20天的EMA相比,急剧下降的可能性可能低于110美元,导致潜在下降至100美元,又可能下降到80美元。 相反,超过20天的EMA的上升将标志着强劲的购买,可能会导致50天的SMA攀升(188美元)。
Dogecoin Price Analysis
Dogecoin价格分析
Dogecoin (DOGE) fell below the $0.18 support on March 9th, indicating a resumption of the downtrend.
Dogecoin(Doge)在3月9日的支持下低于0.18美元的支持,表明恢复下降趋势。
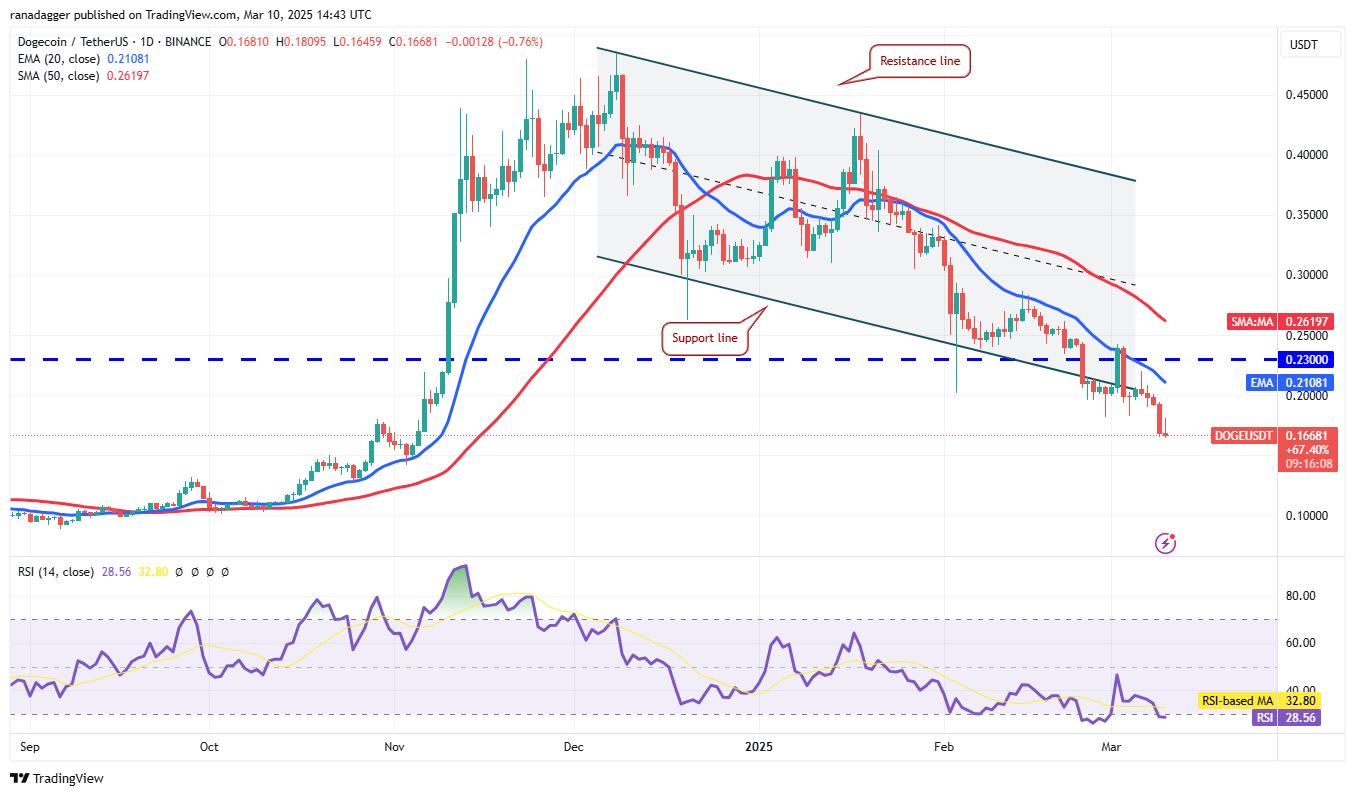
Downward-sloping moving averages and an RSI in oversold territory suggest bear market dominance. The 20-day EMA ($0.21) is a key resistance level. A sharp decline from this EMA could lead to a drop to $0.14. A break and close above the 20-day EMA would signal easing selling pressure, potentially leading to a rise towards the 50-day SMA ($0.26), which could also act as resistance.
向下倾斜的移动平均值和在超售领土上的RSI表明熊市的统治地位。 20天EMA(0.21美元)是关键阻力水平。与此EMA的急剧下降可能会导致下降到0.14美元。 突破并在20天的EMA上面接近,这会表示缓解销售压力,这可能导致50天SMA(0.26美元)的上升,这也可能充当阻力。
Cardano Price Analysis
Cardano价格分析
Cardano (ADA) fell below its moving averages on March 8th, indicating strong selling pressure.
Cardano(ADA)于3月8日低于其移动平均值,表明销售压力很大。
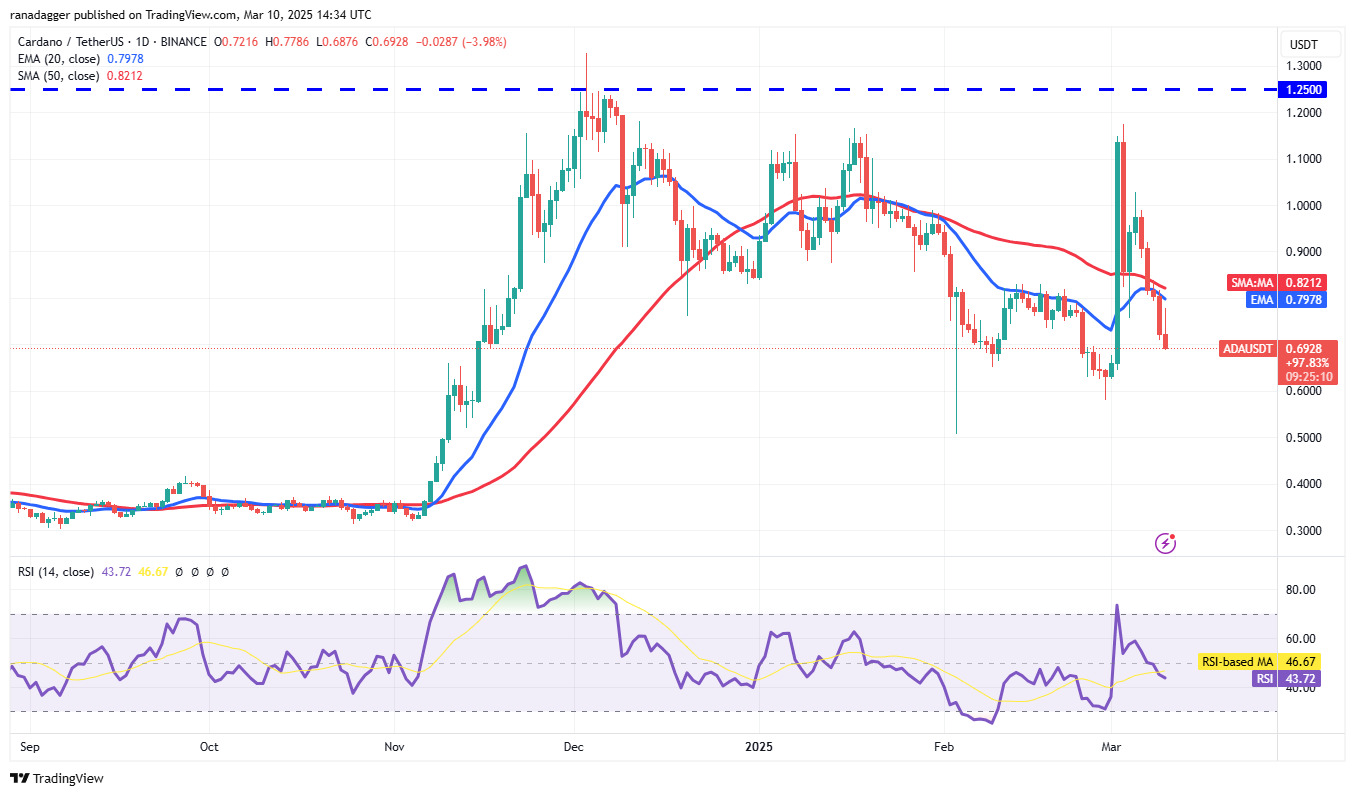
Downward-sloping moving averages and an RSI in negative territory suggest a slight bearish edge. Support levels exist at $0.58 and $0.50. Any relief rally is likely to face selling pressure at the moving averages. Sustained price action above the moving averages would be needed to signal a potential recovery, potentially leading to a rise towards $1.02.
向下倾斜的移动平均值和在负区域中的RSI表明略有看跌边缘。 支持水平的存在为$ 0.58和0.50美元。 任何救济集会都可能在移动平均值上面临销售压力。 需要持续的价格行动以高于移动的平均值来表明潜在的恢复,这可能导致上涨至1.02美元。
Pi Price Analysis
PI价格分析
Pi (PI) fell to the 61.8% Fibonacci retracement level of $1.20 on March 9th, indicating continued bear pressure.
3月9日,PI(PI)跌至61.8%的斐波那契回收期1.20美元,表明持续的熊压力。
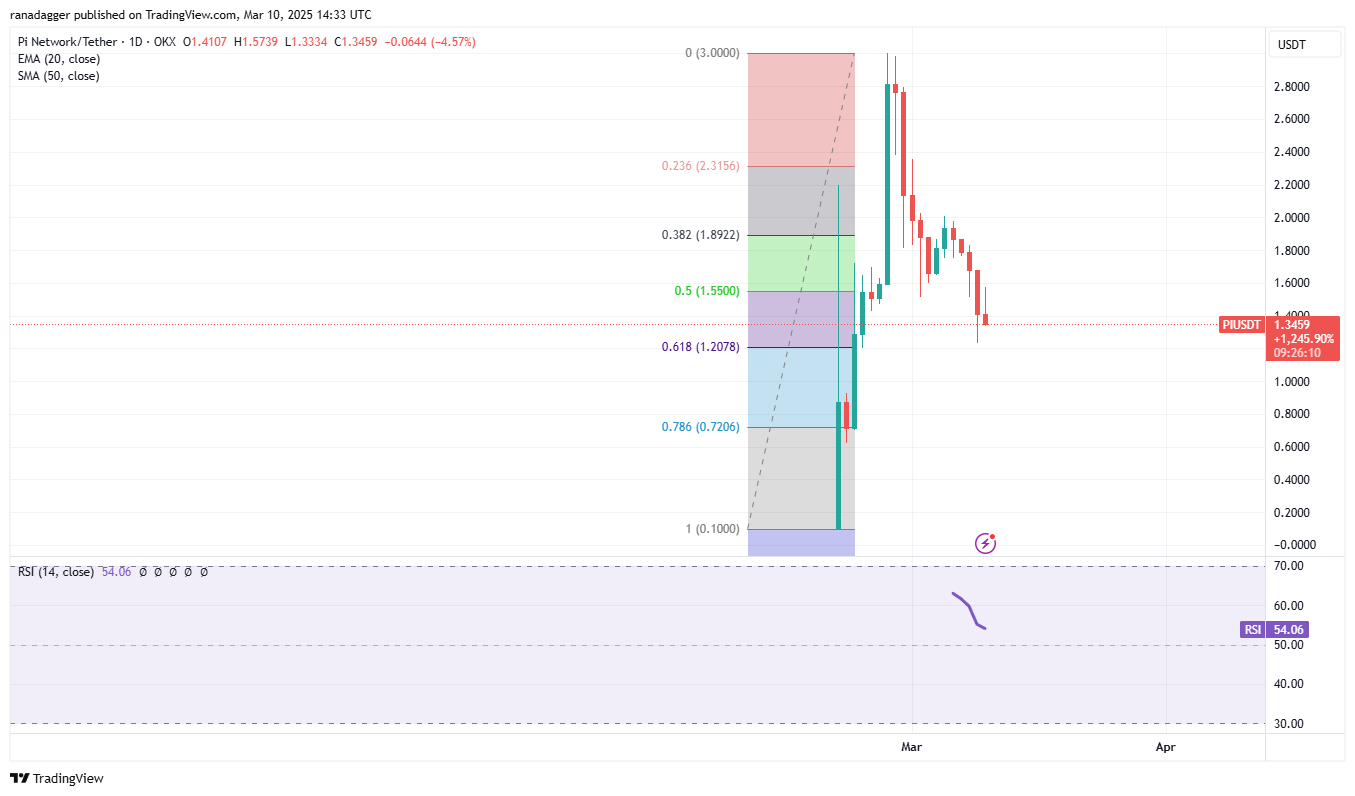
Buyers are attempting a recovery, but a long wick on the March 10th candlestick shows selling at higher levels. This increases the risk of a break below $1.20, potentially leading to a decline to the 78.6% retracement level of $0.72. To prevent further downside, bulls need to quickly push the price above the $2 resistance level, which would suggest the correction may be over.
买家正在尝试恢复,但是在3月10日烛台表演中以更高水平销售的灯芯很长。 这增加了休息时间低于1.20美元的风险,可能导致下降到78.6%的回收水平为0.72美元。 为了防止进一步的缺点,公牛需要迅速将价格提高到2美元的电阻水平以上,这表明更正可能已经结束。
Disclaimer: This article does not provide investment advice or recommendations. All investment and trading decisions involve risk, and readers should conduct their own thorough research before making any decisions.
免责声明:本文不提供投资建议或建议。 所有投资和交易决策都涉及风险,读者应在做出任何决定之前进行自己的详尽研究。
 U_Today
 U_Today
 Optimisus
 Crypto Front News
 DogeHome
 Cointribune
 CoinPedia News
 CoinoMedia
 CoinEagle.com


