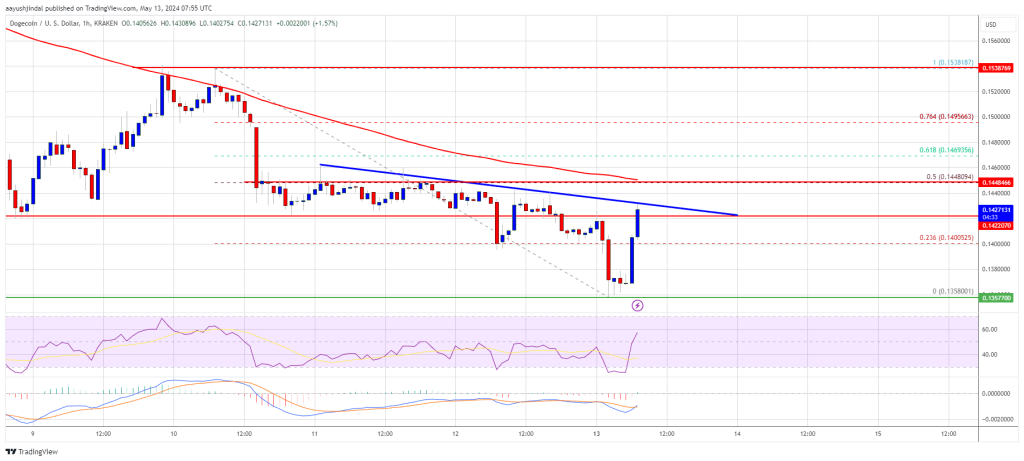
,Dogecoin extended losses and traded below the $0.1420 support zone against the US Dollar. DOGE is now recovering but facing key hurdles at $0.1450.
,狗狗幣擴大跌幅,兌美元匯率跌破 0.1420 美元支撐區。 DOGE 目前正在復甦,但面臨 0.1450 美元的關鍵障礙。
DOGE price tested the $0.1360 support and started a recovery wave. The price is trading below the $0.1450 level and the 100 simple moving average (4 hours). There is a key bearish trend line forming with resistance at $0.1430 on the 4-hour chart of the DOGE/USD pair (data source from Kraken). The price must settle above $0.1450 to move into a positive zone and start a fresh surge.
DOGE 價格測試了 0.1360 美元的支撐位並開始了復甦浪潮。價格低於 0.1450 美元水準和 100 簡單移動平均線(4 小時)。 DOGE/USD 貨幣對的 4 小時圖表上形成了一條關鍵的看跌趨勢線,阻力位為 0.1430 美元(數據來源來自 Kraken)。價格必須穩定在 0.1450 美元上方才能進入正值區域並開始新一輪上漲。
Dogecoin Price Extends Losses
狗狗幣價格擴大損失
After a close below $0.150, Dogecoin price extended losses and moved into a short-term bearish zone, like Bitcoin and Ethereum. There was a drop below the $0.1450 support zone. A low was formed at $0.1358 and DOGE is attempting a recovery wave.
收盤價低於 0.150 美元後,狗狗幣價格擴大跌幅,並進入短期看跌區域,就像比特幣和以太坊一樣。跌破 0.1450 美元支撐區。低點形成於 0.1358 美元,DOGE 正在嘗試復甦浪潮。
There was a minor increase above the $0.1420 resistance level. The price climbed above the 23.6% Fib retracement level of the downward move from the $0.1538 swing high to the $0.1358 low. Dogecoin is still below the $0.1450 level and the 100 simple moving average (4 hours). On the upside, the price is facing resistance near the $0.1430 level. There is also a key bearish trend line forming with resistance at $0.1430 on the 4-hour chart of the DOGE/USD pair. The next major resistance is near the $0.1450 level and the 100 simple moving average (4 hours). It coincides with the 50% Fib retracement level of the downward move from the $0.1538 swing high to the $0.1358 low.  Source: DOGEUSD on TradingView.com
在 0.1420 美元阻力位上方小幅上漲。價格攀升至 23.6% Fib 回檔位(從 0.1538 美元的波動高點跌至 0.1358 美元的低點)。狗狗幣仍低於 0.1450 美元水準和 100 簡單移動平均線(4 小時)。從好的方面來看,價格在 0.1430 美元附近面臨阻力。 DOGE/USD 貨幣對的 4 小時圖表上還形成了一條關鍵的看跌趨勢線,阻力位為 0.1430 美元。下一個主要阻力位在 0.1450 美元水準和 100 簡單移動平均線(4 小時)附近。它與從 0.1538 美元波動高點到 0.1358 美元低點的下行走勢的 50% Fib 回檔位一致。資料來源:TradingView.com 上的 DOGEUSD
A close above the $0.1450 resistance might send the price toward the $0.1535 resistance. Any more gains might send the price toward the $0.1620 level.
收盤價高於 0.1450 美元阻力位可能會將價格推向 0.1535 美元阻力位。任何更多的上漲可能會將價格推向 0.1620 美元的水平。
Another Decline In DOGE?
DOGE 再次下跌?
If DOGE’s price fails to gain pace above the $0.1450 level, it could start another decline. Initial support on the downside is near the $0.140 level. The next major support is near the $0.1360 level. If there is a downside break below the $0.1360 support, the price could decline further. In the stated case, the price might decline toward the $0.1200 level.
如果 DOGE 的價格未能突破 0.1450 美元的水平,則可能會開始另一次下跌。下行的初步支撐位於 0.140 美元附近。下一個主要支撐位在 0.1360 美元附近。如果跌破 0.1360 美元支撐位,價格可能會進一步下跌。在上述情況下,價格可能會跌向 0.1200 美元的水平。
Technical Indicators
技術指標
4 Hours MACD – The MACD for DOGE/USD is now losing momentum in the bearish zone.
4 小時 MACD – DOGE/USD 的 MACD 現在正在失去看跌區域的動力。
4 Hours RSI (Relative Strength Index) – The RSI for DOGE/USD is now above the 50 level.
4 小時 RSI(相對強度指數)-DOGE/USD 的 RSI 目前高於 50 水準。
Major Support Levels – $0.1400, $0.1360 and $0.1200.
主要支撐位 – 0.1400 美元、0.1360 美元和 0.1200 美元。
Major Resistance Levels – $0.1430, $0.1450, and $0.1535.
主要阻力位 – 0.1430 美元、0.1450 美元和 0.1535 美元。


 Optimisus
 Crypto News Land
 Optimisus
 Cryptopolitan_News
 DogeHome
 Cryptopolitan
 crypto.ro English


