With the previous week bringing gains for the cryptocurrency market, some digital assets displayed promising signals that might indicate their future movement. Dogecoin (DOGE) is one of those.
隨著上週加密貨幣市場的上漲,一些數位資產顯示出有希望的訊號,可能表明其未來的走勢。狗狗幣(DOGE)就是其中之一。
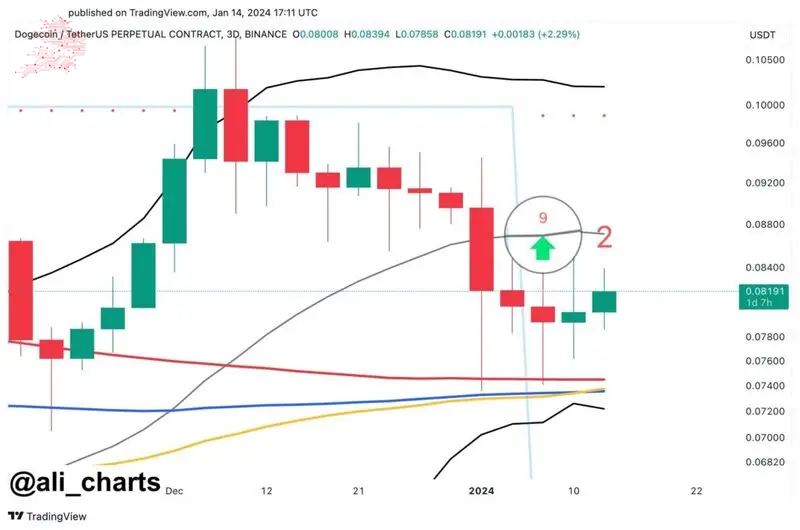
The TD Sequential has recently generated a buy signal on the 3-day chart for Dogecoin. The probability of a resurgence to $0.100 or beyond appears favorable, contingent upon the sustained stability of the $0.074 support cluster, per a post on X by crypto analyst Ali Martinez on January 14.
TD Sequential 最近在狗狗幣 3 日圖表上產生了買入訊號。根據加密貨幣分析師 Ali Martinez 於 1 月 14 日在 X 上發表的一篇文章,反彈至 0.100 美元或更高的可能性似乎是有利的,這取決於 0.074 美元支撐集群的持續穩定性。

「類別=「wp-image-149075」srcset=「/uploads/20240115/170531490265a50a567a429.png 1024w,/uploads/20240115/17053149024w,/uploads/20240115/1705314902670250267 115 /170531490265a50a567a429.png 768w,/uploads/20240115/170531490265a50a567a429。 png 1536w,/uploads/20240115/170531490265a50a567a429.png 2048w“尺寸=”(最大寬度:1024px)100vw,1024px“>
The TD sequential is a robust tool crafted to pinpoint the precise moment of trend fatigue and subsequent price reversal. As a counter-trend instrument, it addresses the limitations observed in various technical Analysis indicators that prove profitable in trending markets but exhibit suboptimal performance in sideways or ranging markets.
TD 序列是一款強大的工具,旨在精確定位趨勢疲勞和隨後價格反轉的精確時刻。作為一種反趨勢工具,它解決了各種技術分析指標中觀察到的局限性,這些指標在趨勢市場中證明是有利可圖的,但在橫盤或區間市場中卻表現出次優的表現。
Another technical indicator is not so optimistic
另一項技術指標則不那麼樂觀
Many technical indicators should be employed to determine whether a potential surge for DOGE is viable and to be expected soon.
應採用許多技術指標來確定 DOGE 的潛在激增是否可行且很快就會出現。
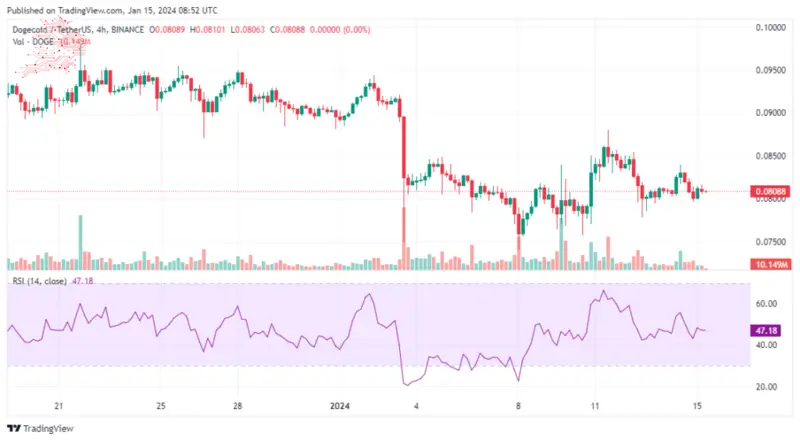
A relative strength index (RSI) is designed to chart the market’s present and past strengths or weaknesses, relying on the closing prices observed over a recent trading period.
相對強度指數 (RSI) 旨在根據最近交易期間觀察到的收盤價來繪製市場當前和過去的優勢或劣勢。
Despite the rebound of the Dogecoin price, there are no optimistic indications in the daily relative strength index (RSI). A reading exceeding 50 and an upward trajectory signify a prevailing advantage for bulls, while readings below 50 are bearish. The daily RSI stands at 47 as of the press time.
儘管狗狗幣價格反彈,但每日相對強弱指數(RSI)並沒有樂觀的跡象。讀數超過 50 且呈上升趨勢表示多頭佔據主導優勢,而讀數低於 50 則表示看跌。截至發稿時,每日 RSI 為 47。

Dogecoin price analysis
狗狗幣價格分析
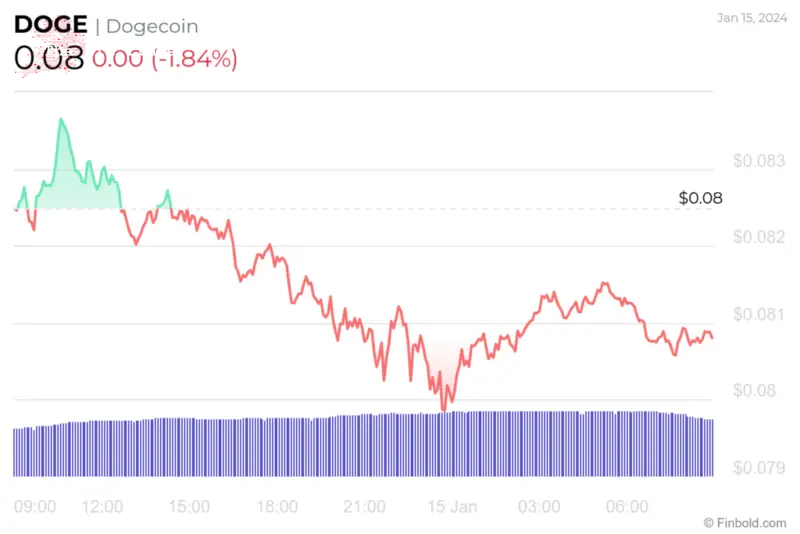
At the time of press, DOGE was trading at $0.0809, marking a daily decrease of -1.83%, contrary to the gains of 3.77% on the weekly chart and losing -16.22% in the previous month.
截至發稿時,DOGE 交易價格為 0.0809 美元,日跌幅為 -1.83%,而周線圖上漲 3.77%,上個月跌幅為 -16.22%。

「類別=「wp-image-149077」srcset=「/uploads/20240115/170531490465a50a58e02f8.png 1024w,/uploads/20240115/17053149024w,/uploads/20240115/1705314902460200202002100202/p 115 /170531490465a50a58e02f8.png 768w,/uploads/20240115/170531490465a50a58e02f8。 png 1200w”尺寸=“(最大寬度:1024px)100vw,1024px”>
Technical indicators are currently unfavorable for the DOGE price, leaning towards a ‘sell’ signal at 11, with moving averages aligning with a ‘sell’ recommendation at 10. On the other hand, oscillators maintain a neutral stance, registering a value of 9.
技術指標目前對 DOGE 價格不利,傾向於在 11 處發出「賣出」訊號,移動平均線在 10 處與「賣出」建議一致。另一方面,振盪指標保持中性立場,值為 9。

「類別=「wp-image-149078」srcset=「/uploads/20240115/170531490565a50a593682b.png 1024w,/uploads/20240115/170531490568259056 115 /170531490565a50a593682b.png 768w,/uploads/20240115/170531490565a50a593682b。 png 1501w”尺寸=“(最大寬度:1024px)100vw,1024px”>
When looking at digital asset prices, it is essential to look at as many indicators as possible, as only then will investors be able to see the bigger picture. This helps in preventing unnecessary risks.
在觀察數位資產價格時,必須考慮盡可能多的指標,只有這樣投資者才能看到更大的圖像。這有助於防止不必要的風險。
Disclaimer: The content on this site should not be considered investment advice. Investing is speculative. When investing, your capital is at risk.
免責聲明:本網站的內容不應被視為投資建議。投資是投機性的。投資時,您的資本面臨風險。
Source: https://thebittimes.com/doge-price-prediction-as-expert-forecasts-target-above-0-10-tbt76587.html
資料來源:https://thebittimes.com/doge-price-prediction-as-expert-forecasts-target-above-0-10-tbt76587.html


 ETHNews
 CFN
CFN U_Today
 Thecoinrepublic.com
 DogeHome
 Optimisus
 Optimisus
 DeFi Planet
 Crypto Daily™


