Shiba Inu Poised for Volatility Spike; Moving Averages Converge
柴犬準備迎接波動性飆升;移動平均線收斂
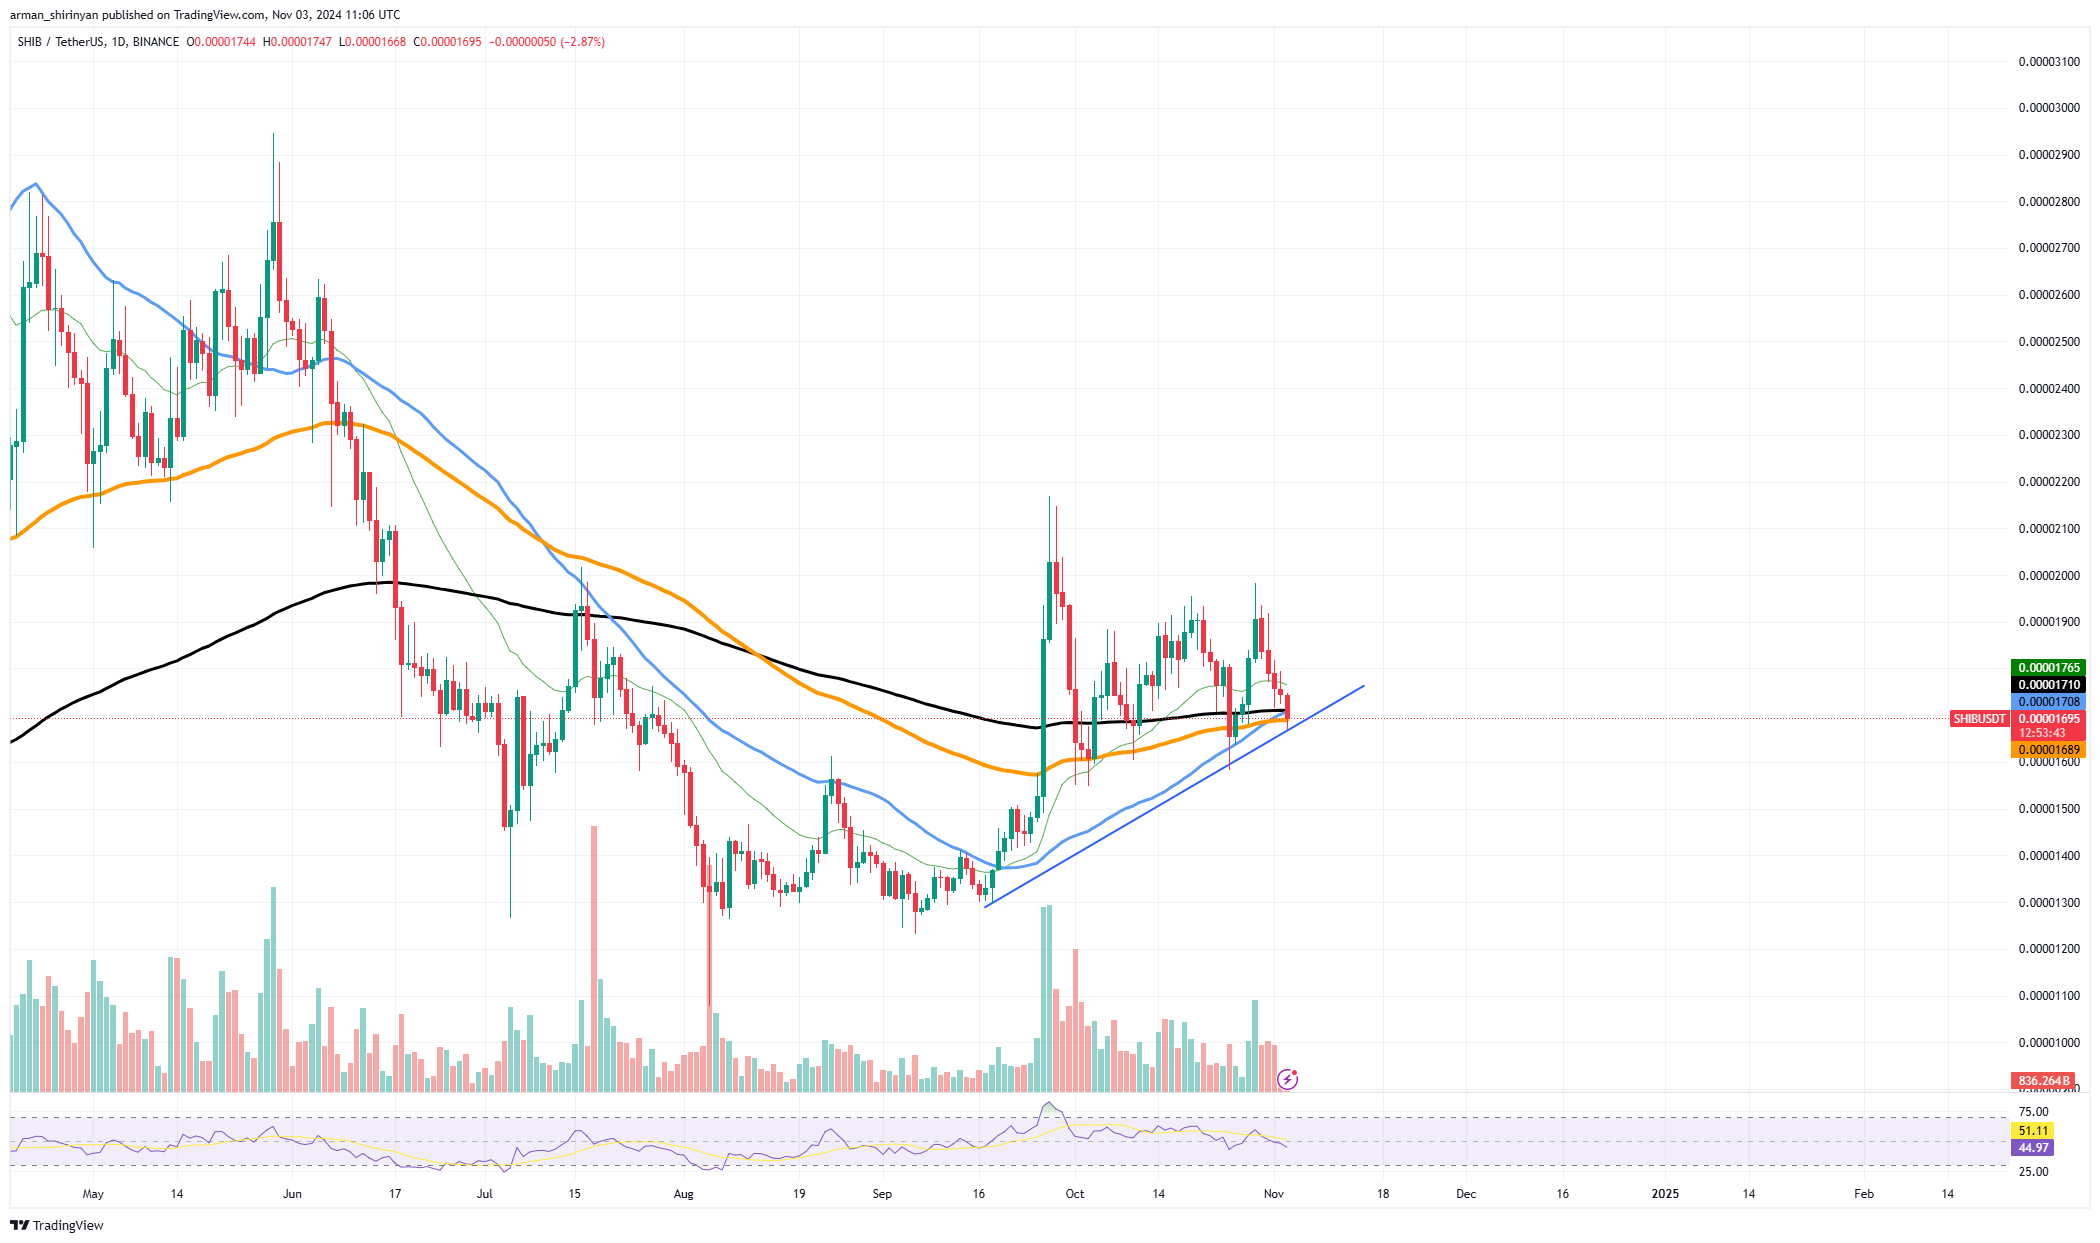
Shiba Inu has been on the mend in recent weeks after a notable upswing in September. Traders are keeping a close eye on the cryptocurrency as its key moving averages on the chart converge, signaling a potential spike in price volatility.
柴犬的數量在九月顯著上升後,最近幾週一直在改善。隨著圖表上關鍵移動平均線的收斂,交易者正在密切關注加密貨幣,這表明價格波動可能會加劇。
Historically, moving average convergence has often preceded an approaching spike in price volatility. On the current chart, SHIB's moving averages, particularly the 50-100 and 200-day EMAs, are coming closer together, indicating a technical setup that typically occurs before a breakout.
從歷史上看,移動平均線收斂往往先於價格波動即將飆升。在當前圖表上,SHIB 的移動平均線,特別是 50-100 日均線和 200 日均線越來越接近,表明通常在突破之前出現的技術設定。
This pattern often acts as a precursor to a significant price movement as the market gathers enough momentum to push past resistance levels or drop towards support. A successful breakout from this convergence could lead to a substantial price increase for SHIB, with crucial resistance levels around $0.000018 and $0.000019. 
當市場聚集足夠的動力來突破阻力位或跌向支撐位時,這種模式通常是價格大幅波動的前兆。成功突破這一收斂可能會導致 SHIB 價格大幅上漲,關鍵阻力位約為 0.000018 美元和 0.000019 美元。
A bullish rally may be fueled if these levels are breached, encouraging further buying pressure. Conversely, if the volatility spike results in a decline for SHIB, the asset must stay above the latest trendline support at $0.0000168 to maintain the bullish structure.
如果突破這些水平,可能會推動看漲反彈,從而加劇進一步的買盤壓力。相反,如果波動性飆升導致 SHIB 下跌,則該資產必須保持在最新趨勢線支撐位 0.0000168 美元之上,才能維持看漲結構。
The Relative Strength Index (RSI) currently resides in a neutral zone, adding to the bullish sentiment by indicating that SHIB has the potential for upward momentum without immediately hitting overbought territory.
相對強弱指數(RSI)目前位於中性區域,顯示 SHIB 有上升勢頭而不會立即觸及超買區域,從而增加了看漲情緒。
Dogecoin Uptrend Takes a Pause
狗狗幣上升趨勢暫停
Despite Dogecoin's recent 15% drop from its recent highs, there is no cause for panic. This correction may actually be beneficial for the asset's overall trajectory, as it is a common occurrence in robust uptrends, enabling the asset to establish a stronger foundation for future gains.
儘管狗狗幣最近從近期高點下跌了 15%,但沒有理由恐慌。這種修正實際上可能有利於資產的整體軌跡,因為它在強勁的上升趨勢中很常見,使資產能夠為未來的收益奠定更堅實的基礎。
As the current chart shows, Dogecoin has experienced a remarkable rally in recent weeks, breaking through several resistance levels with considerable force. This type of sharp ascent often results in overbought conditions, necessitating a price pullback for a more sustainable growth pattern.
正如目前圖表所示,狗狗幣最近幾週經歷了顯著的反彈,以相當大的力量突破了幾個阻力位。這種急劇上漲通常會導致超買狀況,需要價格回檔才能實現更永續的成長模式。
The current retracement aligns with a classic technical setup where an asset resets before resuming its trend. Adding to the positive perception of this correction is the support present around the 50-day and 100-day EMAs.
目前的回調符合經典的技術設置,即資產在恢復趨勢之前會重置。 50 日和 100 日均線附近的支撐增加了對此次修正的正面看法。
These moving averages may provide solid footing for Dogecoin to recover from, as they currently converge near key price levels. In technical analysis, these support levels can act as launchpads, increasing the asset's ability to continue its upward trend.
這些移動平均線可能為狗狗幣的復甦提供堅實的基礎,因為它們目前收斂於關鍵價格水平附近。在技術分析中,這些支撐位可以充當發射台,提高資產繼續其上升趨勢的能力。
Market sentiment for Dogecoin remains strong, which will likely result in renewed buying pressure once this correction levels off. Furthermore, the Relative Strength Index (RSI) has moved away from overbought levels, suggesting that DOGE can now appreciate without immediately encountering selling pressure.
狗狗幣的市場情緒依然強勁,一旦回檔趨於平穩,可能會導致新的購買壓力。此外,相對強弱指數(RSI)已脫離超買水平,顯示 DOGE 現在可以升值,而不會立即遇到拋售壓力。
BTC Recovery Still Possible
BTC仍有可能復甦
Bitcoin recently retreated after briefly touching the $70,000 mark, but attention is now shifting to a potential resurgence point near its 26-day Exponential Moving Average (EMA). Bitcoin is currently hovering around this pivotal level, and the asset's next move could determine whether it attempts to reclaim $70,000.
比特幣最近在短暫觸及 70,000 美元大關後回落,但注意力現在轉向 26 天指數移動平均線 (EMA) 附近的潛在復甦點。比特幣目前徘徊在這一關鍵水平附近,該資產的下一步走勢可能決定是否試圖收回 70,000 美元。
In uptrends, the 26 EMA, depicted as the green line on the chart, often acts as a dynamic support level, attracting buying interest during corrections. Bitcoin has historically rebounded when it has declined to this level, and if similar support materializes now, a significant short-term rally could occur.
在上升趨勢中,26 EMA(圖表上綠線所示)通常充當動態支撐位,在修正期間吸引買盤興趣。從歷史上看,當比特幣跌至這一水平時,就會反彈,如果現在出現類似的支撐,則可能會出現大幅的短期反彈。
However, it is important to note that while the 26 EMA provides a technical setup that could lead to a reversal, it is not a foolproof guarantee of recovery. The recent downward momentum in Bitcoin warrants caution, as further declines are possible if EMA support fails.
然而,值得注意的是,雖然 26 EMA 提供了可能導致逆轉的技術設置,但它並不是萬無一失的復甦保證。比特幣近期的下跌勢頭值得謹慎,因為如果 EMA 支撐失敗,比特幣可能會進一步下跌。
In that scenario, BTC could retest lower supports such as the 50 or even 100 EMAs. Nevertheless, if buyers step in at the 26 EMA, Bitcoin could swiftly regain momentum and make another run at $70,000. This level has become a psychological barrier, and a decisive close above it could rekindle bullish sentiment and propel Bitcoin to test its previous all-time highs.
在這種情況下,BTC 可能會重新測試較低的支撐位,例如 50 甚至 100 EMA。然而,如果買家在 26 EMA 介入,比特幣可能會迅速恢復勢頭,再次升至 70,000 美元。這一水平已成為一個心理障礙,果斷收於該水平之上可能會重新點燃看漲情緒,並推動比特幣測試之前的歷史高點。
In conclusion, the way Bitcoin reacts to the 26 EMA could determine its near-term trajectory. While the level presents a recovery opportunity, investors should be prepared for either scenario.
總之,比特幣對 26 EMA 的反應方式可能決定其近期走勢。雖然該水準提供了復甦機會,但投資者應該為這兩種情況做好準備。


 BlockchainReporter
 CoinPedia News
 TheNewsCrypto
 CFN
CFN DogeHome
 Optimisus
 Crypto News Land
 Optimisus


