Ethereum at Pivotal Point
以太坊处于关键点
Ethereum is poised at a crucial juncture as it attempts to break free from its persistent downtrend. Recent gains have seen ETH surge past key resistance levels, signaling trader optimism.
以太坊正处于一个关键时刻,试图摆脱持续的下跌趋势。最近的上涨使 ETH 突破了关键阻力位,这表明交易者的乐观情绪。
Currently hovering around $2,624, Ethereum faces resistance at $2,780. However, selling pressure has hampered its progress. A pivotal moment approaches, with support at $2,550 crucial for maintaining momentum.
目前以太坊徘徊在 2,624 美元附近,但面临 2,780 美元的阻力。然而,抛售压力阻碍了其进展。关键时刻即将到来,2,550 美元的支撑对于保持势头至关重要。
The Relative Strength Index (RSI) indicates trader scrutiny of Ethereum's recovery or potential correction. The market's indecision leaves its future unclear. Short-term price movements hinge on trader decisions at this juncture.
相对强弱指数(RSI)表明交易者对以太坊复苏或潜在修正的审查。市场的犹豫不决使其未来不明朗。短期价格走势取决于交易者此时的决定。
Dogecoin's Bullish Trend
狗狗币的看涨趋势
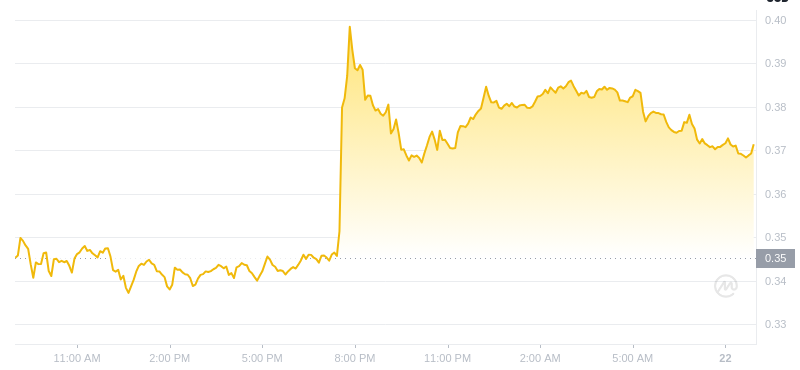
Dogecoin has gained 5%, crossing the crucial 100 EMA. As it approaches the 200 EMA, optimism grows. A bullish shift and trend reversal could occur should Dogecoin surpass the 200 EMA.
狗狗币上涨了 5%,突破了关键的 100 EMA。随着接近 200 EMA,乐观情绪增强。如果狗狗币突破 200 EMA,则可能会出现看涨转变和趋势逆转。
The formation of a golden cross, where the short-term moving average crosses above the long-term, is pivotal. Such a pattern conveys strong bullish sentiment and signals a potential market breakout.
黄金交叉的形成(短期移动平均线穿过长期移动平均线)至关重要。这种模式传达了强烈的看涨情绪,并预示着潜在的市场突破。
Traders anticipate a breakout that could trigger a long-term uptrend. However, market sentiment and resistance at $0.12 (200 EMA) must be considered. A failure to break this level could lead to consolidation or a decline.
交易员预计突破可能引发长期上升趋势。然而,必须考虑市场情绪和 0.12 美元(200 EMA)的阻力位。如果未能突破这一水平,可能会导致盘整或下跌。
Bitcoin's Technical Patterns
比特币的技术模式
Bitcoin displays chart patterns with significant implications. Traders speculate two possible patterns: a double bottom (bullish) and a head and shoulders (bearish).
比特币显示的图表模式具有重大意义。交易者推测两种可能的形态:双底(看涨)和头肩顶(看跌)。
A double bottom forms when the price reaches a low, rebounds, and tests the low again before rising. This suggests a market recovery. If the double bottom holds, Bitcoin may challenge the $65,000 resistance level.
当价格触及低点、反弹并在上涨之前再次测试低点时,就会形成双底。这表明市场正在复苏。如果双底成立,比特币可能会挑战 65,000 美元的阻力位。
Conversely, a head and shoulders pattern indicates a potential price decline after an uptrend. Bitcoin's recent peak of $64,800 could be considered the head, with the previous highs as the shoulders. A break below $61,000 would confirm this pattern.
相反,头肩形态表明价格在上升趋势后可能会下跌。比特币最近的峰值 64,800 美元可以被视为头部,之前的高点可以被视为肩部。跌破 61,000 美元将证实这一模式。
Market observers closely monitor both patterns to gauge their validity. A breakout above $65,000 would suggest bullish momentum, while a break below $61,000 could indicate bearish continuation.
市场观察家密切关注这两种模式以衡量其有效性。突破 65,000 美元将表明看涨势头,而跌破 61,000 美元可能表明看跌势头持续。


 DogeHome
 TheCoinrise Media
 TheCoinrise Media
 CFN
CFN BH NEWS
 DogeHome
 TheCoinrise Media
 Crypto Daily™
 TheCoinrise Media


