

Cover image via U.Today
通过U.Today掩护图像
Dogecoin (DOGE), the dog-themed cryptocurrency, shows potential signs of a trend reversal after a period of decline. Crypto analyst Ali points to a bullish reversal doji forming on the weekly chart – a classic candlestick pattern often signaling a shift in market momentum.
以狗为主题的加密货币Dogecoin(Doge)显示了一段时间后趋势逆转的潜在迹象。 加密分析师阿里(Ali)指出了每周图表上的逆转杜吉(Doji) - 经典的烛台模式通常表明市场动力发生了变化。
Following three consecutive weeks of decline, culminating in a 30% drop last week, a doji pattern has appeared this week on the Dogecoin weekly chart. This doji suggests market indecision and potentially weakening selling pressure, hinting at a possible price rebound if sustained. 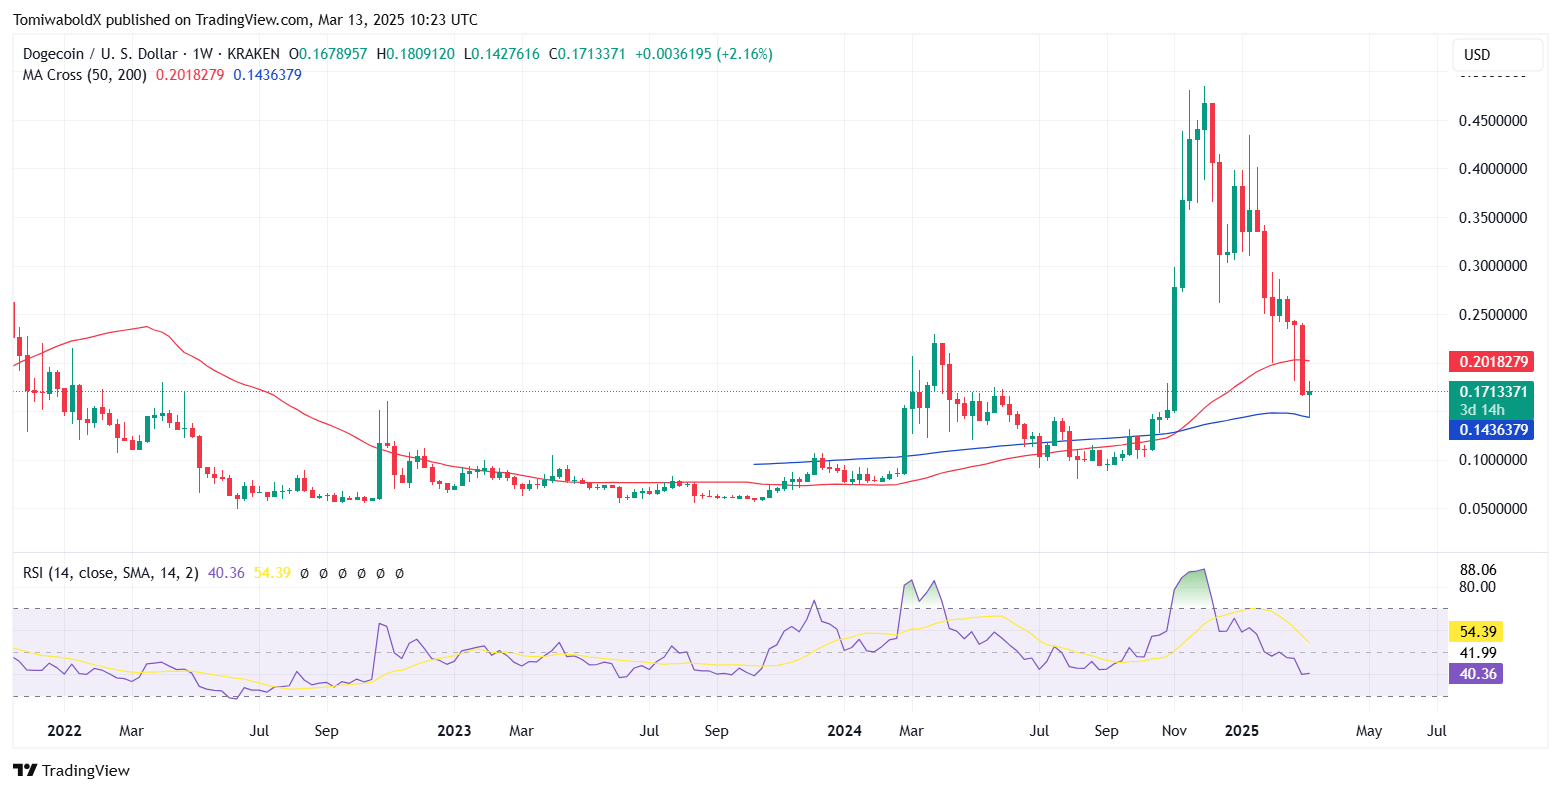 DOGE/USD Weekly Chart, Courtesy: TradingView
在连续三周下降了三周之后,上周下降了30%,本周在Dogecoin每周图表上出现了DOJI模式。 这项Doji表明市场犹豫不决,并有可能减弱销售压力,并暗示如果持续下去可能会反弹。
Ali also noted a surge in Dogecoin's network activity. Active addresses have increased by 47% over the past month, rising from 110,000 to 163,000, indicating growing interest and engagement within the DOGE ecosystem.
阿里还指出,狗狗网络活动激增。 在过去的一个月中,主动地址增长了47%,从110,000增加到163,000,表明DOGE生态系统的兴趣和参与日益增加。
Dogecoin Price Action
Dogecoin价格动作
At the time of writing, Dogecoin is up 2.8% in the last 24 hours, trading at $0.171. After a five-day decline, it rebounded from a low of $0.142 on March 11. This support level is significant, having previously acted as a floor for Dogecoin's rally in early November. This rebound continued into Wednesday's trading session, closing in positive territory.
在撰写本文时,Dogecoin在过去24小时内增长了2.8%,交易价格为0.171美元。经过五天的下降,它从3月11日的低至0.142美元的低点反弹。这一支持水平很大,此前曾在11月初充当Dogecoin集会的地板。 这一反弹一直持续到周三的交易会,在积极的领土上关闭。
While this rebound is encouraging, with Dogecoin potentially forming a bullish double bottom at $0.142, overcoming key resistance levels is crucial to confirm a reversal. A break and close above $0.21 could potentially lead to a rise towards the 50-day SMA resistance at $0.25.
尽管这种反弹令人鼓舞,但Dogecoin可能会以0.142美元的价格形成一个看涨的双重底部,而克服钥匙阻力水平对于确认逆转至关重要。 休息时间超过0.21美元,可能会导致50天的SMA阻力升至0.25美元。
However, a looming bearish indicator threatens to negate this potential bullish reversal. Dogecoin is nearing the formation of a "death cross" on its daily chart. This occurs when the 50-day moving average crosses below the 200-day moving average, typically signaling further price drops.
但是,迫在眉睫的看跌指标威胁到这种潜在的看涨逆转。 Dogecoin在其每日图表上接近“死亡十字架”的形成。 当50天移动平均线越过200天移动平均线以下时,这发生这种情况发生,通常表示进一步的价格下跌。
Should this death cross materialize, DOGE could retest lower support levels before any substantial recovery. Currently, the market awaits further price action as Dogecoin navigates the potential conflict between a bullish reversal and a bearish breakdown. Read the original article on U.Today
如果这种死亡交叉实现,Doge可以在任何实质性恢复之前重新测试较低的支持水平。 目前,当Dogecoin驾驶看涨的逆转与看跌崩溃之间的潜在冲突时,市场正在等待进一步的价格行动。 阅读有关U.Today的原始文章
 Optimisus
 DogeHome
 CoinsProbe
 U_Today
 Coin Edition
 CaptainAltcoin
 The Bit Journal
 TNYR
TNYR


