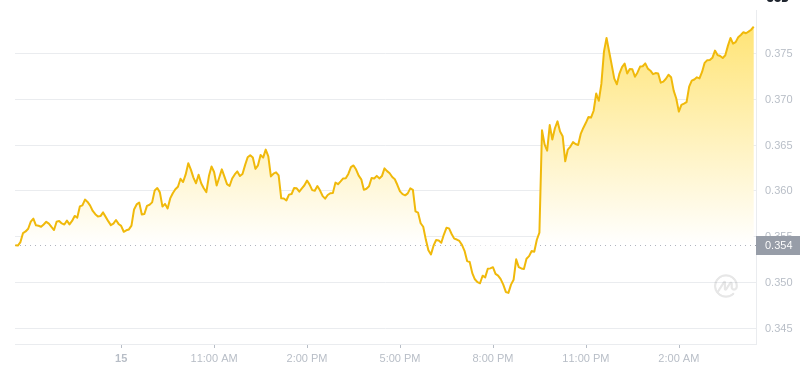
PEPE's Ascendant Trajectory
PEPE的上升轨迹
PEPE has exhibited an impressive upward trend, attracting attention from traders and investors. This sustained rally indicates market confidence and optimism in PEPE's future prospects. Analysts closely monitor key indicators to gauge the duration and potential of this bullish phase.
PEPE呈现出令人印象深刻的上涨趋势,吸引了交易者和投资者的关注。这种持续的上涨表明了市场对 PEPE 未来前景的信心和乐观。分析师密切关注关键指标,以衡量这一看涨阶段的持续时间和潜力。
Price Performance and Indicators
价格表现和指标
At the time of writing, PEPE traded at $0.00001531 with a 3.33% increase. Its market capitalization exceeds $6.3 billion, and the 24-hour trading volume is over $1.5 billion. However, market capitalization and trading volume have declined by 3.51% and 26.3%, respectively, in the last 24 hours.
截至撰写本文时,PEPE 交易价格为 0.00001531 美元,上涨 3.33%。其市值超过63亿美元,24小时交易量超过15亿美元。然而,过去24小时内,市值和交易量分别下降了3.51%和26.3%。
Technical Analysis
技术分析
On the 4-hour time frame:
在 4 小时时间范围内:
- PEPE trades below the 100-day Simple Moving Average (SMA), suggesting potential bullish momentum.
- The 4-hour Moving Average Convergence Divergence (MACD) signals potential bullishness, with MACD histograms moving above the MACD zero line.
- The MACD line and signal line trend below the zero line, but the signal line attempts to cross above the MACD line.
On the 1-day time frame:
PEPE 交投于 100 日简单移动平均线 (SMA) 下方,暗示潜在看涨势头。4 小时移动平均线趋同背离 (MACD) 信号潜在看涨,MACD 柱状图移至 MACD 零线上方。MACD 线和信号线趋势线低于零线,但信号线试图穿越 MACD 线。在 1 天时间范围内:
- PEPE exhibits a pullback followed by a rally, forming a bullish candlestick pattern.
- The 1-day MACD indicates bearishness, with MACD histograms below the MACD zero line and the MACD and signal lines crossing above the zero line. However, price action on the 4-hour timeframe suggests a potential reversal to bullishness.
Future Prospects
PEPE先回调后反弹,形成看涨烛台形态。1日MACD显示看跌,MACD柱状图位于MACD零线下方,MACD和信号线穿越零线上方。然而,4 小时时间范围内的价格走势表明,看涨趋势可能会逆转。 未来前景
PEPE's previous price action suggests key levels at $0.00001731, $0.00001313, $0.00001152, and $0.00000888. A breakout above $0.0001731 may lead to further upward movement, while a break below $0.00001313 could trigger a downward trend.
PEPE 之前的价格走势表明关键水平为 0.00001731 美元、0.00001313 美元、0.00001152 美元和 0.00000888 美元。突破 0.0001731 美元可能会导致进一步上涨,而跌破 0.00001313 美元可能会引发下跌趋势。


 Crypto News Land
 BH NEWS
 DogeHome
 CryptoPotato_News
 CoinsProbe
 U.Today
 BlockchainReporter
 BlockchainReporter
 Crypto Intelligence


