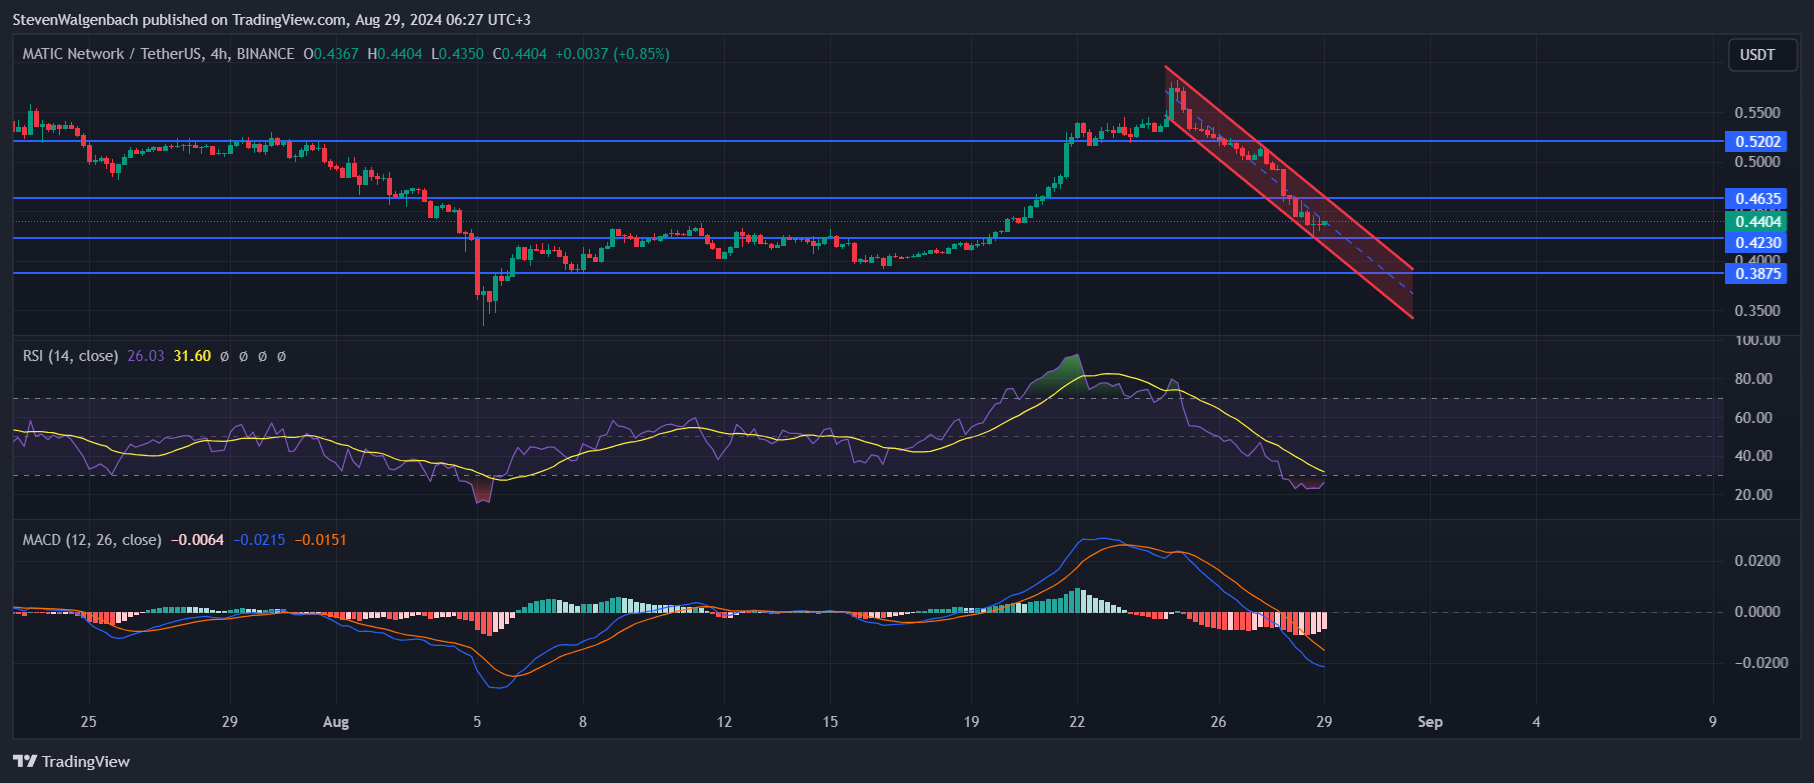
The Polygon price dived more than 17% in the last week following a 4% 24-hour loss to trade at $0.4415 as of 11:38 p.m. EST as traders keep exerting sell pressure on the token.
Polygon 价格上周下跌超过 17%,截至晚上 11:38,24 小时下跌 4%,交易价格为 0.4415 美元。美国东部时间,交易员继续对该代币施加抛售压力。
The drop in the MATIC price comes as Polygon converts its native token to the new POL token. MATIC holders on Ethereum are already able to swap their tokens for POL through the Polygon Portal. No action needs to be taken by MATIC holders on the Polygon chain or holders of staked MATIC, as their tokens will be automatically swapped on Sept. 4.
MATIC 价格下跌是因为 Polygon 将其原生代币转换为新的 POL 代币。以太坊上的 MATIC 持有者已经能够通过 Polygon Portal 将其代币兑换为 POL。 Polygon 链上的 MATIC 持有者或质押 MATIC 的持有者无需采取任何行动,因为他们的代币将于 9 月 4 日自动交换。
The Polygon Price Resting On A Crucial Support Level
多边形价格处于关键支撑位

4-hour chart for MATIC/USDT (Source: TradingView)
MATIC/USDT 4 小时图(来源:TradingView)
The Polygon price has been trading in a descending channel following a series of lower lows and lower highs over the past few days. Now, the altcoin is resting on the key support level at $0.4230. Should it drop below this technical safety net within the next 24 hours, the crypto could stand the risk of plunging to the subsequent mark at $0.3875.
在过去几天出现一系列较低的低点和较低的高点之后,Polygon 价格一直在下降通道中交易。现在,山寨币位于关键支撑位 0.4230 美元。如果在未来 24 小时内跌破这一技术安全网,加密货币可能会面临暴跌至 0.3875 美元的风险。
However, MATIC maintaining a position above the $0.4230 support level for the next 24 hours could invalidate the bearish thesis. In this alternative scenario, the Polygon price might attempt to escape the bearish channel it is currently trapped in.
然而,MATIC 在未来 24 小时内维持在 0.4230 美元支撑位上方的位置可能会使看跌论点失效。在这种替代情况下,Polygon 价格可能会尝试逃离目前陷入的看跌通道。
Technicals Suggest Bulls Are Fighting For Control Of The Polygon Price
技术面表明多头正在争夺多边形价格的控制权
From a technical perspective, indicators on MATIC’s 4-hour chart suggest the altcoin could rise through the course of the next trading day. More specifically, the Moving Average Convergence Divergence (MACD) and the Relative Strength Index (RSI) indicators suggest the bearish momentum is weakening.
从技术角度来看,MATIC 4 小时图表上的指标表明,山寨币可能会在下一个交易日上涨。更具体地说,移动平均收敛分歧(MACD)和相对强弱指数(RSI)指标表明看跌势头正在减弱。
RSI readings have risen throughout the past 24 hours, which traders usually see as an indication of sellers losing strength against buyers. What’s more, the RSI is closing in on its Simple Moving Average (SMA) on the 4-hour chart. An intersection between these two lines soon could signal that bulls have gained control of the Polygon price.
RSI 读数在过去 24 小时内不断上升,交易者通常将其视为卖方对买方力量减弱的迹象。更重要的是,RSI 正在接近 4 小时图表上的简单移动平均线 (SMA)。这两条线之间的交叉很快可能表明多头已经控制了 Polygon 价格。
Meanwhile, the MACD line has started to level off below the MACD Signal line. The prior is also rising towards the latter, which suggests MATIC’s negative trend might be coming to an end.
与此同时,MACD 线已开始在 MACD 信号线下方趋于平稳。前者也在向后者上升,这表明 MATIC 的负面趋势可能即将结束。


 CryptoNewsLand
 DogeHome
 CryptoNewsLand
 crypto.ro English
 CoinoMedia
 TheCoinrise
 Optimisus


