Bitcoin Price Analysis
比特币价格分析
Bitcoin (BTC) has surpassed $106,000. However, bulls face resistance piercing the all-time high of $109,588.
比特币(BTC)超过了106,000美元。然而,公牛队的阻力刺穿了109,588美元的历史最高点。
James Check, Glassnode lead analyst, compares Bitcoin's price action to the 2016-2017 cycle, suggesting a "topping cloud" between $120,000 and $150,000. However, he does not rule out Bitcoin breaking above $150,000, although he assigns it a low probability.
Glassnode 首席分析师 James Check 将比特币的价格走势与 2016-2017 年周期进行了比较,表明“顶部云”在 120,000 美元到 150,000 美元之间。不过,他并不排除比特币突破 15 万美元的可能性,尽管他认为这种可能性很小。
Altcoin Price Analysis
山寨币价格分析
Ether (ETH)
以太(ETH)
ETH bounced off the H&S pattern neckline, indicating bulls' attempts to prevent bearish formation. If buyers propel the price above the 50-day SMA, ETH/USDT could reach $3,745. A decline from the 50-day SMA suggests increased risk of a break below the neckline, potentially leading to a drop to $2,850.
ETH 从 H&S 形态颈线反弹,表明多头试图阻止看跌形成。如果买家推动价格突破 50 日移动平均线,ETH/USDT 可能会达到 3,745 美元。 50 日移动平均线的下跌表明跌破颈线的风险增加,可能导致跌至 2,850 美元。
XRP (XRP)
XRP(XRP)
XRP remains above $2.91, indicating buyer dominance. If the bulls overcome minor resistance at the downtrend line, XRP/USDT could initiate an uptrend, targeting $4 and eventually $4.84. A price reversal and break below the 20-day EMA could trigger a corrective phase towards the 50-day SMA and $2.20.
XRP仍高于2.91美元,表明买方的统治地位。如果公牛队在下降趋势线上克服了次要阻力,则XRP/USDT可以启动上升趋势,目标是4美元,最终目标是4.84美元。价格逆转和低于20天的EMA可能会触发50天SMA的纠正阶段和2.20美元。
Solana (SOL)
索拉纳 (太阳)
SOL has broken out of $260 resistance, suggesting bullish dominance. Minor resistance at $274 is likely to be overcome, leading to a potential surge towards $295 and possibly $375. However, a break and close below the 20-day EMA would indicate a loss of momentum and a potential decline to the 50-day SMA.
SOL 已突破 260 美元阻力位,表明看涨占据主导地位。 274 美元的小阻力可能会被克服,从而导致价格可能飙升至 295 美元,甚至可能上涨至 375 美元。然而,突破并收盘低于 20 日均线将表明动能丧失,并可能跌至 50 日均线。
BNB (BNB)
BNB(BNB)
BNB faces resistance in rising above the moving averages, suggesting bearish attempts to take control. The uptrend line remains a potential support level. A rebound from the uptrend line and rise above the moving averages could lead to a rally towards $745. A break below the uptrend line could trigger a decline towards $635.
BNB面临着在移动平均线之上上升的阻力,这表明看跌试图控制。上升线仍然是潜在的支持水平。从上升线的反弹并超越了移动平均值可能会导致集会到745美元。低于上升线的突破可能会导致下降到635美元。
Dogecoin (DOGE)
Dogecoin(Doge)
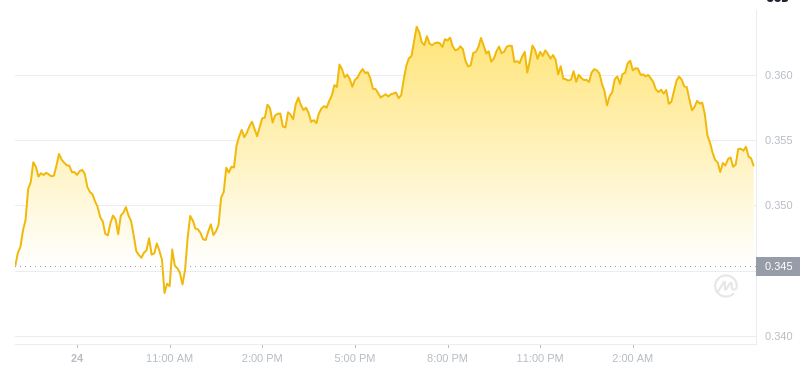
DOGE remains within the ascending channel, indicating buying near the support line and selling near the resistance line. If buyers can push the price above the moving averages, DOGE/USDT could reach $0.40. A break above the channel could initiate a rally towards $0.48. Conversely, a reversal and break below the support line increases the risk of a decline towards $0.30 and $0.27.
DOGE 仍处于上升通道内,表明在支撑线附近买入,在阻力线附近卖出。如果买家能够将价格推高至移动平均线之上,DOGE/USDT 可能会达到 0.40 美元。突破该通道可能会引发反弹至 0.48 美元。相反,反转并跌破支撑线会增加跌向 0.30 美元和 0.27 美元的风险。
Cardano (ADA)
卡达诺(那里)
ADA continues to trade within a symmetrical triangle, suggesting buying near the uptrend line and selling at the resistance line. Buyers pushing the price above the moving averages could drive ADA/USDT towards the resistance line. Bulls must overcome resistance to signal a potential upmove to $1.33. A break below the uptrend line could lead to a correction towards $0.87 and $0.76.
ADA 继续在对称三角形内交易,表明在上升趋势线附近买入并在阻力线附近卖出。买家将价格推至移动平均线上方可能会推动 ADA/USDT 向阻力线移动。多头必须克服阻力才能发出潜在上涨至 1.33 美元的信号。跌破上升趋势线可能导致回调至 0.87 美元和 0.76 美元。
Chainlink (LINK)
LINK bounced off the 20-day EMA, indicating dip-buying by bulls. The rising 20-day EMA and positive RSI suggest an upward trend. Buyers aim to push the price above $27.21, opening the door for a rally to $30.94. A sharp reversal and break below the moving averages could lead to a decline towards $22 and $20.
Avalanche (AVAX)
雪崩 (AVAX)
AVAX has traded below the 20-day EMA but bears have failed to sink the price below $34.49 support. Bulls aim to push the price above the 20-day EMA, potentially leading to a rise towards the 50-day SMA. However, a decline from the 20-day EMA suggests bearish pressure, with the pair likely to retest the $32.31 support.
AVAX 的交易价格低于 20 日均线,但空头未能将价格降至 34.49 美元支撑位以下。多头的目标是将价格推高至 20 日均线上方,从而可能导致价格上涨至 50 日均线。然而,20 日均线的下跌表明看跌压力,该货币对可能会重新测试 32.31 美元的支撑位。
Stellar (XLM)
恒星币 (XLM)
XLM bulls have defended the 50-day SMA but have failed to start a recovery. A push above $0.46 could lead to a rise towards the H&S pattern neckline. Overcoming resistance could result in a surge to $0.64. A price reversal and break below the 50-day SMA indicates bearish momentum, potentially leading to a decline towards $0.39 and $0.31.
XLM Bulls为50天的SMA辩护,但未能开始恢复。超过$ 0.46的推动可能会导致H&S模式领口的上升。克服阻力可能会导致涨幅为0.64美元。价格逆转和低于50天的SMA表明看跌的动力,可能导致下降到0.39美元和0.31美元。
Disclaimer: This article does not constitute investment advice.
免责声明:本文不构成投资建议。


 The Crypto Times
 crypto.ro English
 crypto.ro English
 crypto.ro English
 Crypto Intelligence
 DogeHome
 Optimisus
 Optimisus
 Crypto Intelligence News


