Ali Charts Analyzes Dogecoin Price Movements
After events unfold, retrospective analysis can provide valuable insights that may inform future predictions. Ali Charts' assessment of DOGE exemplifies this approach.
Dogecoin (DOGE)
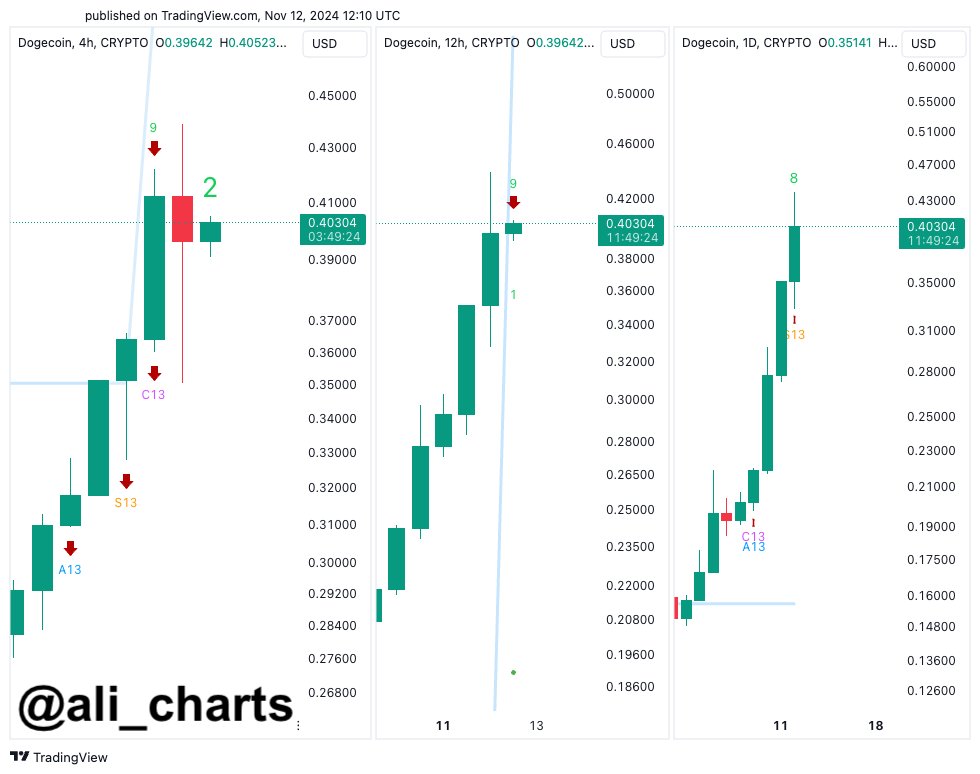
Ali Charts, a seasoned trader, observed sell signals on DOGE's 4-hour, 12-hour, and daily charts, indicating a potential price correction before an upward trend.
"The TD Sequential indicator shows sell signals for #Dogecoin $DOGE on the 4-hour and 12-hour charts, with another signal forming on the daily chart. This suggests a high probability of a price correction before moving higher!"

Following the current pullback, DOGE is expected to continue its upward trajectory. Previous analyses identified $0.35 as a target zone for reaching an all-time high (ATH). DOGE may potentially approach $1 in the near future.
Cryptocurrencies and Experience
Cryptocurrency markets exhibit patterns that experienced traders can recognize. While some analysts dismissed cryptocurrencies in November 2022, others anticipated current market conditions.
"When Bitcoin broke its ATH in December 2020, it rallied for a few days. Suddenly, a red candle appeared, causing panic among those traumatized by the bear market. A week later, it started rising again, though this time, it surged even more dramatically before slowing down. Markets behave this way."


 Cointelegraph
 Cryptopolitan_News
 Optimisus
 Thecoinrepublic.com
 Cryptopolitan_News
 CaptainAltcoin
 DogeHome
 crypto.news


