Ali Charts Analyzes Dogecoin Price Movements
阿里圖表分析狗狗幣價格走勢
After events unfold, retrospective analysis can provide valuable insights that may inform future predictions. Ali Charts' assessment of DOGE exemplifies this approach.
事件發生後,回顧性分析可以提供有價值的見解,為未來的預測提供資訊。 Ali Charts 對 DOGE 的評估就體現了這種方法。
Dogecoin (DOGE)
狗狗幣 (DOGE)
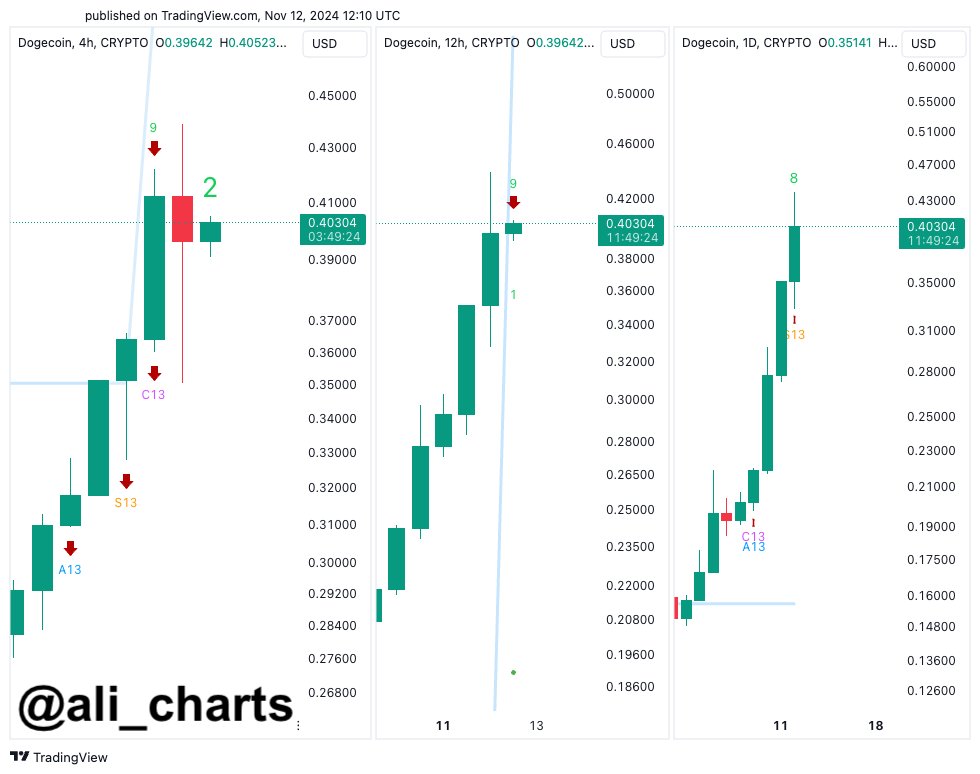
Ali Charts, a seasoned trader, observed sell signals on DOGE's 4-hour, 12-hour, and daily charts, indicating a potential price correction before an upward trend.
經驗豐富的交易員 Ali Charts 在 DOGE 的 4 小時、12 小時和日線圖表上觀察到賣出訊號,表明在上升趨勢之前可能存在價格修正。
"The TD Sequential indicator shows sell signals for #Dogecoin $DOGE on the 4-hour and 12-hour charts, with another signal forming on the daily chart. This suggests a high probability of a price correction before moving higher!"
“TD 順序指標在 4 小時和 12 小時圖表上顯示 #Dogecoin $DOGE 的賣出信號,並在日線圖表上形成另一個信號。這表明價格在走高之前很有可能會出現回調!”

Following the current pullback, DOGE is expected to continue its upward trajectory. Previous analyses identified $0.35 as a target zone for reaching an all-time high (ATH). DOGE may potentially approach $1 in the near future.
在當前回調之後,DOGE 預計將繼續其上升軌跡。先前的分析將 0.35 美元確定為達到歷史高點 (ATH) 的目標區域。 DOGE 可能在不久的將來接近 1 美元。
Cryptocurrencies and Experience
加密貨幣和經驗
Cryptocurrency markets exhibit patterns that experienced traders can recognize. While some analysts dismissed cryptocurrencies in November 2022, others anticipated current market conditions.
加密貨幣市場表現出經驗豐富的交易者可以識別的模式。儘管一些分析師在 2022 年 11 月對加密貨幣不屑一顧,但其他分析師則對當前的市場狀況進行了預測。
"When Bitcoin broke its ATH in December 2020, it rallied for a few days. Suddenly, a red candle appeared, causing panic among those traumatized by the bear market. A week later, it started rising again, though this time, it surged even more dramatically before slowing down. Markets behave this way."
「當比特幣在2020 年12 月突破ATH 時,它連續幾天上漲。突然出現了一根紅蠟燭,引起了那些遭受熊市創傷的人們的恐慌。一周後,它再次開始上漲,儘管這一次甚至飆昇在放緩之前,市場表現會更加劇烈。


 Thecryptoupdates
 DogeHome
 The Crypto Times
 Coincu
 Optimisus
 Coin_Gabbar
 Optimisus


