Bitcoin Fluctuates Amidst Bullish Momentum
Bitcoin's upward trajectory has met with some resistance, raising questions about the sustainability of its momentum. The cryptocurrency currently stands at $104,899, a 1.21% drop after retracing from a peak of $106,214. Nonetheless, the overall trend remains bullish, although signs of fatigue are emerging. Notably, Bitcoin continues to adhere closely to its rising trendline.
Despite the pullback, Bitcoin remains above key support levels, maintaining the rally that began in late October. The 50 EMA (Exponential Moving Average) has served as a reliable dynamic support, with the $98,400 and $97,500 levels potentially providing further cushioning against selling pressure. Volume fluctuations should also be closely monitored, as a decrease in buying volume could indicate weakening bullish sentiment.
A breakout above $106,000 was expected to attract new buyers, but the lack of follow-through suggests a short-term decline rather than a complete reversal. Bitcoin's immediate direction is largely dependent on its ability to maintain support above the trendline. If it breaks below this level, the next significant support is located near $90,000.
Overall, Bitcoin's bullish outlook remains intact. Corrections like this are common in extended rallies, and the uptrend is still on track. To validate the next leg up, Bitcoin must decisively break above its previous high. Otherwise, the market may cool off and enter a more extensive consolidation phase.
Ethereum Faces Pullback
Ethereum has shown signs of weakness after failing to maintain momentum at its recent local peak near $4,100. The price has since retraced by 0.69% to $3,867, raising concerns about a potential bearish trend. Dropping below the recent high is the first warning sign, while difficulties holding above the 20-day EMA (currently around $3,707) further underscore the bearish sentiment. If this level fails to hold, the 50 EMA (near $3,355) will be the next key support.
A break below this range could indicate a shift in market sentiment and push Ethereum closer to the $3,000 psychological level. Additionally, volume data is a cause for concern, as November's surge in buying has tapered off in recent sessions. Waning buying pressure suggests that bulls may be losing steam, leaving Ethereum vulnerable to further selling.
Technically, a bearish divergence is beginning to form on Ethereum's price chart. The Relative Strength Index (RSI) is showing signs of stagnation near 63, a level that often indicates a loss of bullish momentum despite prices hitting a local high. If the RSI continues to decline, it could confirm a deeper bearish trend.
Despite the short-term bearish outlook, Ethereum's overall long-term trend remains positive, provided it holds above key support levels. The $3,707 and $3,355 support zones are crucial for investors to monitor, as a bounce from these levels could revive bullish momentum and pave the way for a potential recovery.
Dogecoin Declines Towards Key Support
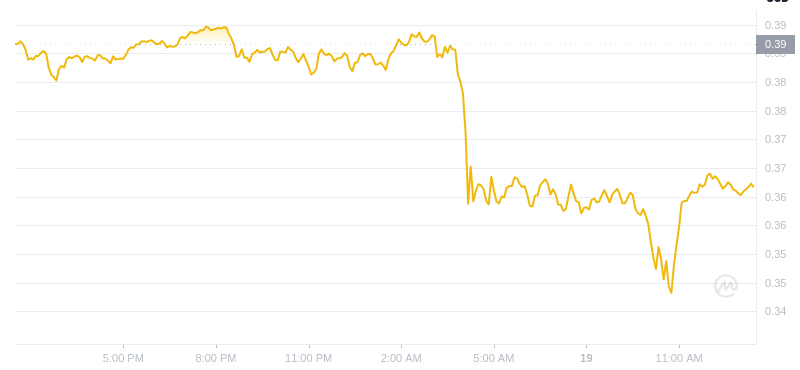
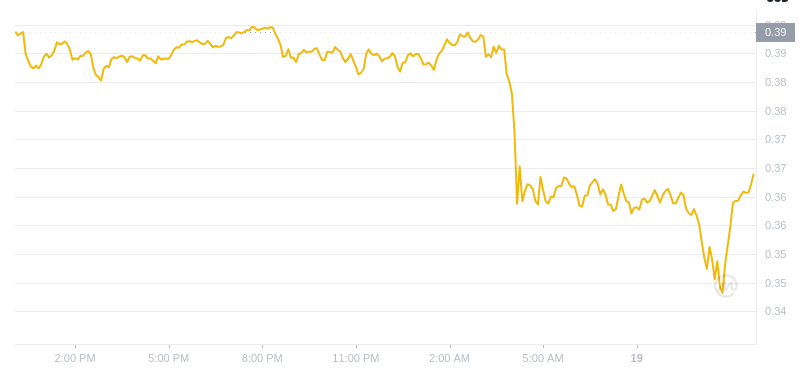
Dogecoin continues to drift lower as it grapples to stay above critical support levels. The meme coin currently trades at $0.386, down approximately 2.04% over the past day, with a concerning technical outlook. Dogecoin's recent price action has clearly broken down from the ascending channel that served as a key support during its recent rally.
The $0.45 region has now emerged as strong resistance, and this breakdown could soon see Dogecoin approaching the 50-day EMA (currently at $0.35). While this level provides strong technical support, it is concerning that the asset is testing it so soon after its rally.
The declining volume during this pullback further highlights the waning buying pressure. With demand lacking, DOGE bulls are hesitant to step in, leaving the asset vulnerable to further declines. If the 50 EMA fails to hold, the next critical support is at $0.28.
A drop below this level could open the way for a more severe correction towards $0.21, a level not seen since Dogecoin's last significant breakout in November. While not yet in oversold territory, DOGE's current position near 56 on the RSI (Relative Strength Index) front indicates that downward momentum is intensifying. If the RSI continues to decline, the market may confirm bearish dominance.


 DogeHome
 Cryptos Newss
 TheNewsCrypto
 TheCoinrise Media
 Optimisus
 U_Today
 DogeHome
 The Crypto Times
 Crypto Intelligence


