After a sudden dip that retraced the Bitcoin (BTC) price, this flagship crypto is slowly recuperating, and one pattern can be a sign of bullish things to come.
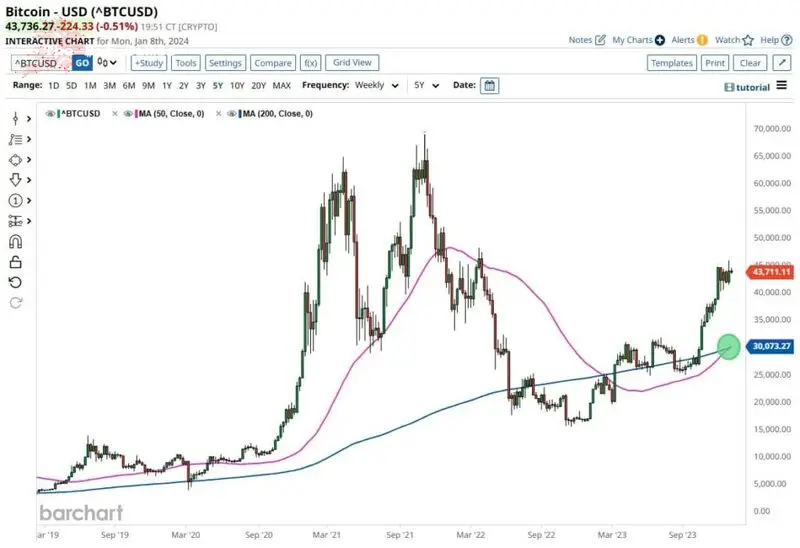
BTC has recently experienced a significant event in the trading realm known as the “Golden Cross.” This occurrence marks the first time this bullish pattern has manifested on the weekly chart, as per X post from analytics platform Barchart on January 8.

A golden cross is identified when an asset’s short-term moving average (MA) surpasses its long-term moving average, signaling positive market sentiment.
What can the Golden Cross mean for BTC?
The occurrence on this cryptocurrency’s weekly chart involves the 50-week moving average surpassing the 200-week MA. Traditionally, this pattern is interpreted as a positive signal, hinting at the potential for a sustained upward trend.
Nonetheless, it’s crucial to recognize that the Golden Cross can function as a lagging indicator. When this cross occurs, the market might have already incorporated the bullish sentiment, indicating that the pattern confirms an existing trend rather than forecasting a new one.
Bitcoin price analysis
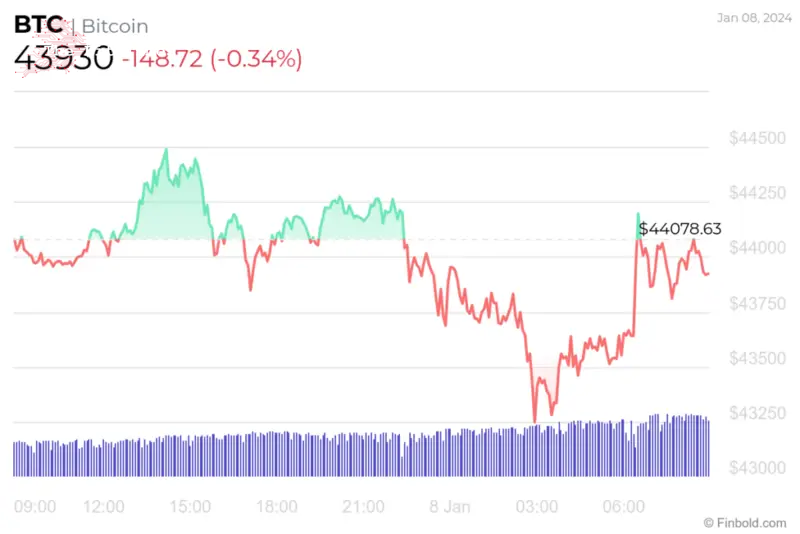
However, despite the formation of Golden Cross, the BTC price has experienced a downturn, losing approximately -0.34% of its value in the previous 24 hours.

On the weekly chart, things seem more optimistic due to the addition of 3.43% while still losing -0.62% during the last 30 days, as per the latest data obtained on January 8.
At the same time, the technical indicators indicate a prevailing sentiment labeled as ‘buy.’
An integrated evaluation of these indicators assigns a ‘buy’ rating at 15, with moving averages signaling a ‘strong buy’ at 13. Oscillators are tilting towards a ‘neutral’ rating, registering at 8.

Despite the formation of the weekly Golden Cross, it is essential to note that various sets of elements influence Bitcoin’s price.
Disclaimer: The content on this site should not be considered investment advice. Investing is speculative. When investing, your capital is at risk.


 CoinPedia News
 CoinoMedia
 Optimisus
 CFN
CFN CFN
CFN The Crypto Times
 Cryptopolitan_News
 Crypto News Land
 CryptoNewsLand


