After a sudden dip that retraced the Bitcoin (BTC) price, this flagship crypto is slowly recuperating, and one pattern can be a sign of bullish things to come.
ビットコイン(BTC)価格を反転させた突然の下落の後、この主力仮想通貨はゆっくりと回復しており、あるパターンは今後の強気の兆しである可能性があります。
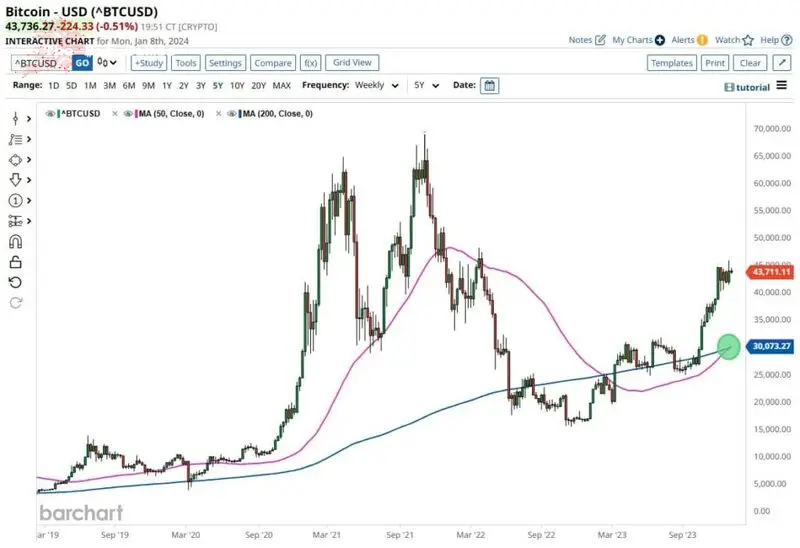
BTC has recently experienced a significant event in the trading realm known as the “Golden Cross.” This occurrence marks the first time this bullish pattern has manifested on the weekly chart, as per X post from analytics platform Barchart on January 8.
BTCは最近、取引分野で「ゴールデンクロス」として知られる重要なイベントを経験しました。分析プラットフォームBarchartの1月8日のX投稿によると、この出来事は、この強気のパターンが週足チャートに現れたのは初めてである。

A golden cross is identified when an asset’s short-term moving average (MA) surpasses its long-term moving average, signaling positive market sentiment.
ゴールデン クロスは、資産の短期移動平均 (MA) が長期移動平均を上回ったときに特定され、市場センチメントがポジティブであることを示します。
What can the Golden Cross mean for BTC?
ゴールデンクロスはBTCにとって何を意味するのでしょうか?
The occurrence on this cryptocurrency’s weekly chart involves the 50-week moving average surpassing the 200-week MA. Traditionally, this pattern is interpreted as a positive signal, hinting at the potential for a sustained upward trend.
この仮想通貨の週足チャートでの出来事には、50週移動平均が200週移動平均線を超えることが含まれます。伝統的に、このパターンは持続的な上昇傾向の可能性を示唆するポジティブなシグナルとして解釈されています。
Nonetheless, it’s crucial to recognize that the Golden Cross can function as a lagging indicator. When this cross occurs, the market might have already incorporated the bullish sentiment, indicating that the pattern confirms an existing trend rather than forecasting a new one.
それにもかかわらず、ゴールデンクロスは遅行指標として機能する可能性があることを認識することが重要です。このクロスが発生した場合、市場はすでに強気の感情を織り込んでいる可能性があり、このパターンが新しいトレンドを予測するのではなく、既存のトレンドを確認していることを示しています。
Bitcoin price analysis
ビットコイン価格分析
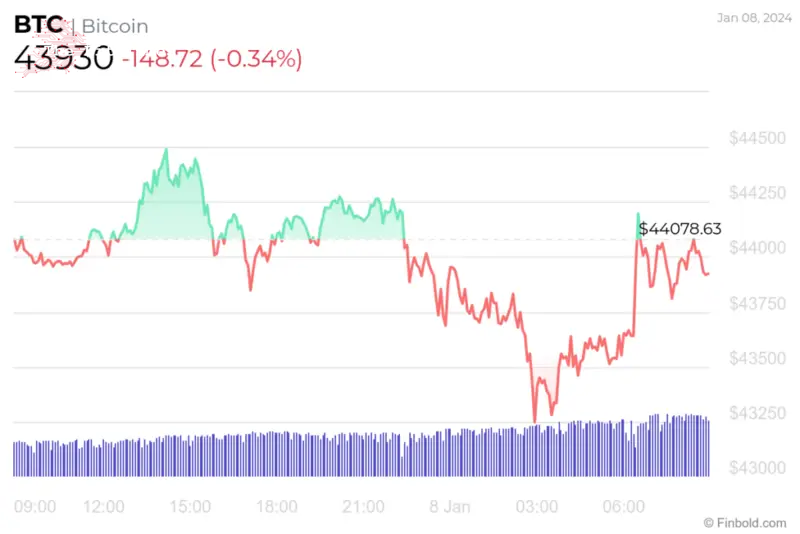
However, despite the formation of Golden Cross, the BTC price has experienced a downturn, losing approximately -0.34% of its value in the previous 24 hours.
しかし、ゴールデンクロスの形成にもかかわらず、BTC価格は下落し、過去24時間でその価値の約-0.34%を失いました。

" class="wp-image-147834" srcset="/uploads/20240108/1704711782659bd66682680.png 1024w、/uploads/20240108/1704711782659bd66682680.png 300w、/uploads/202401 08/1704711782659bd66682680.png 768w、/uploads/20240108/1704711782659bd66682680。 png 1200w" sizes="(max-width: 1024px) 100vw, 1024px">
On the weekly chart, things seem more optimistic due to the addition of 3.43% while still losing -0.62% during the last 30 days, as per the latest data obtained on January 8.
週足チャートでは、1月8日に取得された最新データによると、過去30日間でまだ-0.62%下落しているにもかかわらず、3.43%上昇しているため、状況はより楽観的に見えます。
At the same time, the technical indicators indicate a prevailing sentiment labeled as ‘buy.’
同時に、テクニカル指標は「買い」とラベル付けされた一般的なセンチメントを示しています。
An integrated evaluation of these indicators assigns a ‘buy’ rating at 15, with moving averages signaling a ‘strong buy’ at 13. Oscillators are tilting towards a ‘neutral’ rating, registering at 8.
これらの指標を総合的に評価すると、15 で「買い」格付けが割り当てられ、移動平均は 13 で「強い買い」を示します。オシレーターは 8 で「中立」格付けに傾いています。

Despite the formation of the weekly Golden Cross, it is essential to note that various sets of elements influence Bitcoin’s price.
毎週のゴールデンクロスの形成にもかかわらず、さまざまな要素がビットコインの価格に影響を与えることに注意することが重要です。
Disclaimer: The content on this site should not be considered investment advice. Investing is speculative. When investing, your capital is at risk.
免責事項: このサイトのコンテンツは投資アドバイスとみなされるべきではありません。投資は投機的なものです。投資する場合、資本はリスクにさらされます。
出典: https://thebittimes.com/bitcoin-forms-first-ever-weekly-golden-cross-what-it-means-for-btc-price-tbt75874.html


 Cryptopolitan
 DogeHome
 crypto.ro English
 Crypto News Land
 ETHNews
 CFN
CFN U_Today
 Thecoinrepublic.com


