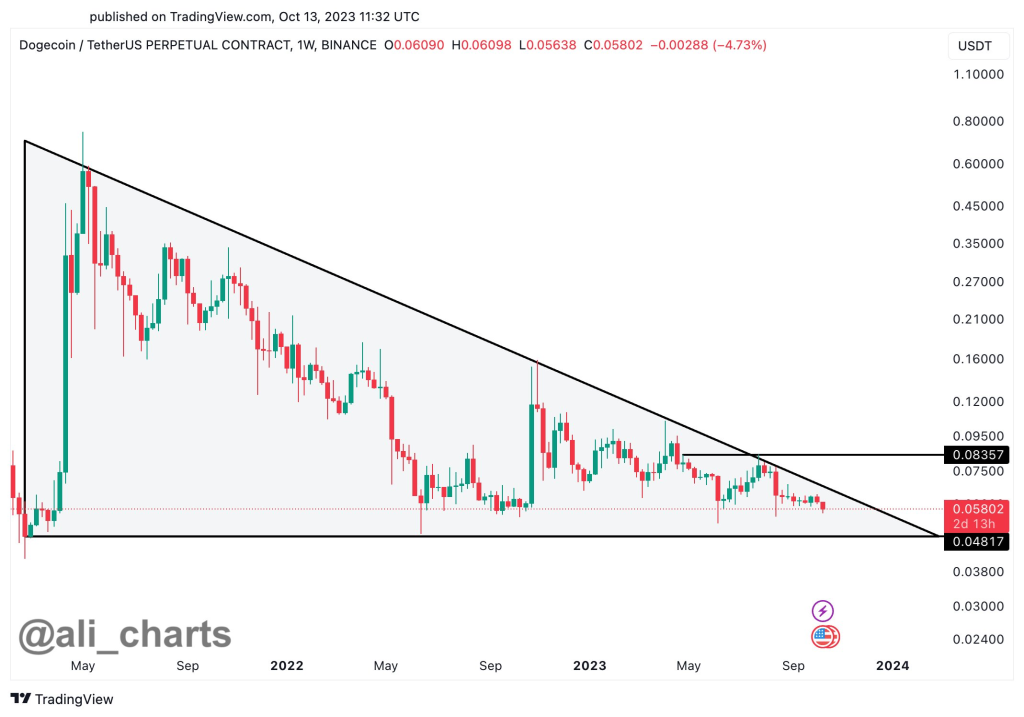
Dogecoin, the popular meme-inspired cryptocurrency, has the potential to see major gains in the near future, according to crypto analyst Ali. In a recent tweet, Ali pointed out that DOGE is approaching the apex of a large multi-year descending triangle formation on its chart.
Descending triangle patterns are bearish chart formations that typically lead to a breakdown. However, Ali believes if Dogecoin can close above resistance at $0.0835 on the weekly chart, it could be the catalyst for the start of a new bull run toward $1.

However, Ali cautions that there is a big catch. If Dogecoin fails to hold support around $0.0482 on the weekly chart, it risks breaking down and potentially hitting new yearly lows.
So in essence, Dogecoin is approaching a make-or-break point. A weekly close above $0.0835 could signal the start of a new bull market for DoGE. However, failure to hold above $0.0482 could lead to additional downsides.
Dogecoin has been in a prolonged bear market since 2021 amid the broader crypto winter. Like many altcoins, it has struggled with waning investor interest and skepticism around crypto as an asset class. However, crypto analysts like Ali believe DOGE’s technical setup on the charts suggests there is still hope for a turnaround. The descending triangle apex often leads to big moves in either direction.
For DOGE bulls, the big question is whether the meme coin can get the momentum to finally break out of its triangle to the upside. Or will the bearish pressures overwhelm and lead to a breakdown? The coming weeks will be crucial and could set the tone for Dogecoin’s price action for the next major trend.
Dogecoin Technical Analysis Shows Bearish Momentum
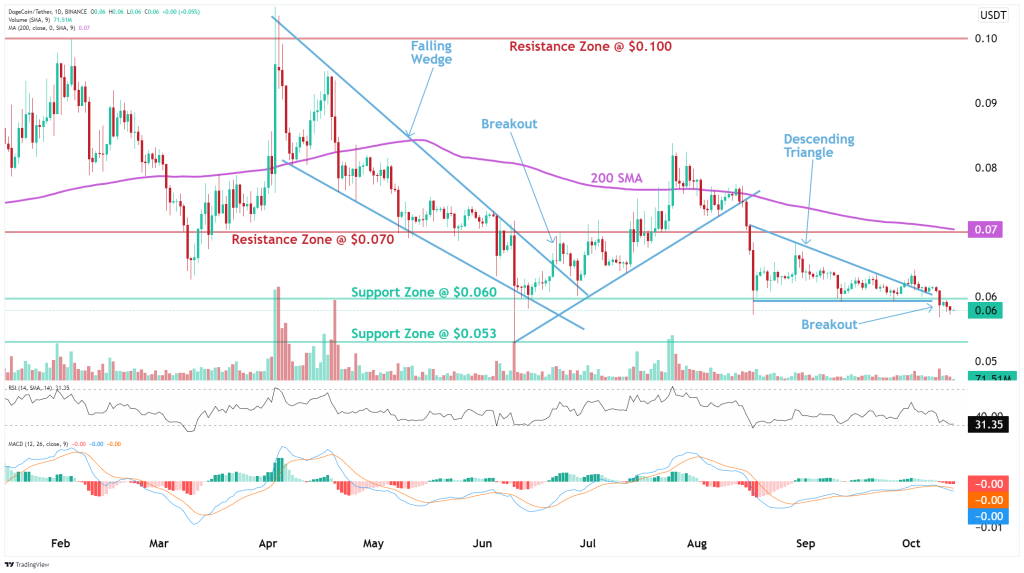
Based on DOGE’s price analysis by crypto analytics firm AltFINS, its technical picture is looking decidedly bearish across short-, medium-, and long-term timeframes.
The analysis points to a bearish breakout from a descending triangle pattern that opens up significant downside risk for the coin. The meme-inspired cryptocurrency recently broke below key support at $0.060 and now risks a drop toward the next support zone around $0.053.

Source: altFINS – Start using it today
Looking at key momentum indicators, the MACD line is below the MACD signal line on the daily timeframe, pointing to building downside momentum. The relative strength index (RSI) is below 45, also signaling extremely bearish momentum.
With DOGE breaking triangle support, the path of least resistance appears to be to the downside. There is not much bullish momentum evident on the charts that could lead to a trend reversal anytime soon.
On the upside, DOGE faces resistance zones at $0.060, $0.070, and $0.100. It would likely need a sustained push above these areas to turn the overall multi-week trend from bearish to bullish.
For now, Dogecoin investors should exercise caution and wait for technical signs of a trend reversal before calling a bottom. The path of least resistance based on the price action and momentum indicators is for more downside.
We recommend eToro
Wide range of assets: cryptocurrencies alongside other investment products such as stocks and ETFs.
Copy trading: allows users to copy the trades of leading traders, for free.
User-friendly: eToro’s web-based platform and mobile app are user-friendly and easy to navigate.
eToro offers staking for certain popular cryptocurrencies like ETH, ADA, XTZ etc.
The post Dogecoin (DOGE) Price Can Reach $1 According to Crypto Analyst, but There’s a Big Catch appeared first on CaptainAltcoin.


 Optimisus
 Thecryptoupdates
 DogeHome
 The Crypto Times
 Coincu
 Optimisus
 Coin_Gabbar
 Optimisus


