

Dogecoin Shows Signs of Rising Momentum
Dogecoin (DOGE/USDT) is currently navigating a crucial technical zone, with key indicators suggesting a shift in market momentum. While the four-hourly timeframe shows a declining trend, recent activity hints at a potential breakout.
RSI Breakout and Bullish Momentum
Technical analyst Trader Tardigrade observes a significant RSI breakout on the four-hour chart. The RSI, previously trending downward, has crossed above its resistance line, exceeding the 40 level. This signals increased bullish momentum. Historically, such RSI breakouts often precede shifts in price action, suggesting growing buyer control.
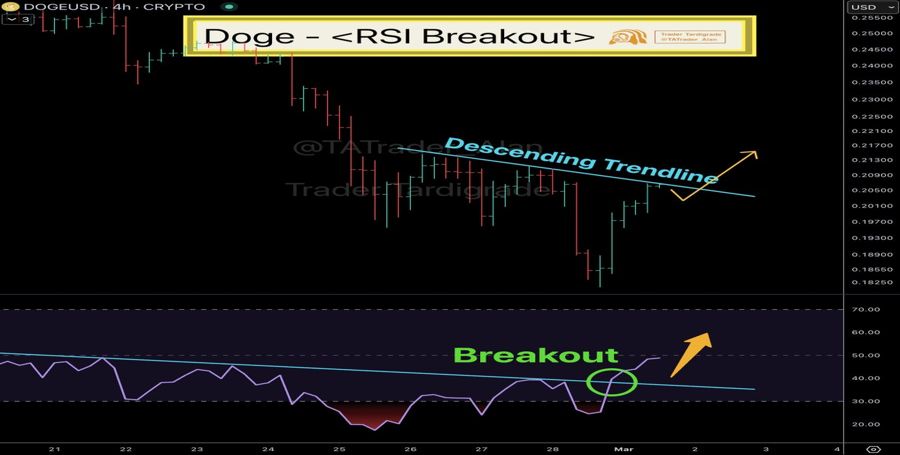
Source: Trader Tardigrade
This RSI breakout has spurred a price push towards the descending trendline resistance. A successful break above this resistance could trigger further upward movement. Conversely, failure to break through could lead to a pullback or extended consolidation. Market participants are keenly watching this crucial level to gauge Dogecoin's next move.
Falling Wedge Pattern and Impending Price Change
Another market observer, Satoshi Flipper, identifies a falling wedge pattern forming on Dogecoin's chart. The price is approaching the wedge's apex, characterized by two converging trendlines. Historically, falling wedges precede significant price breakouts. The narrowing price range indicates decreasing volatility, often a precursor to a substantial price change.
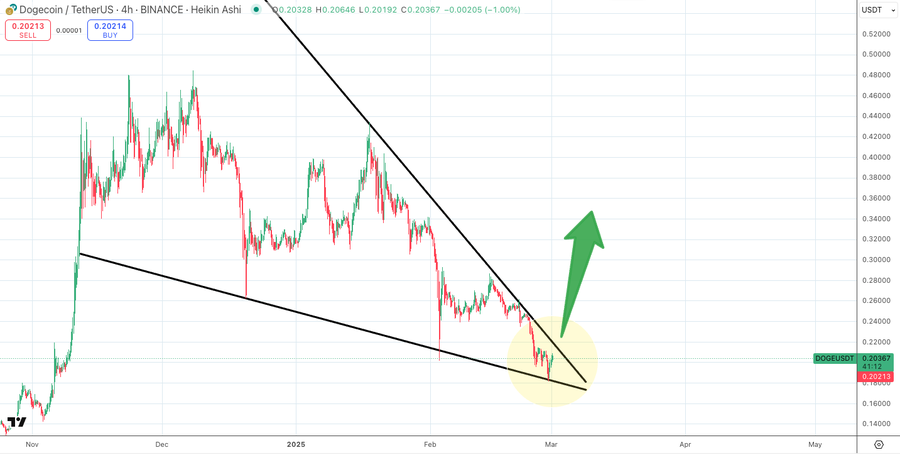
Source: Satoshi Flipper
Dogecoin's price is currently hovering around $0.20213, a level acting as both support and resistance within the lower boundary of the falling wedge. A reversal at this level could lead to further consolidation. However, a decisive break above this resistance could ignite a bullish rally. Analysts emphasize that the market remains at a critical juncture, and subsequent price action will depend heavily on how it interacts with these key technical levels.
 Crypto News Land
 DogeHome
 Crypto News Land
 IT Times
 suncrypto.in
 Cryptos Newss
 Optimisus
 Thecoinrepublic.com


