

Dogecoin Shows Signs of Rising Momentum
Dogecoinは、勢いが高まる兆候を示しています
Dogecoin (DOGE/USDT) is currently navigating a crucial technical zone, with key indicators suggesting a shift in market momentum. While the four-hourly timeframe shows a declining trend, recent activity hints at a potential breakout.
Dogecoin(Doge/USDT)は現在、重要な技術ゾーンをナビゲートしており、重要な指標は市場の勢いの変化を示唆しています。 4時間の時間枠は低下の傾向を示していますが、最近の活動は潜在的なブレイクアウトを示唆しています。
RSI Breakout and Bullish Momentum
RSIブレイクアウトと強気の勢い
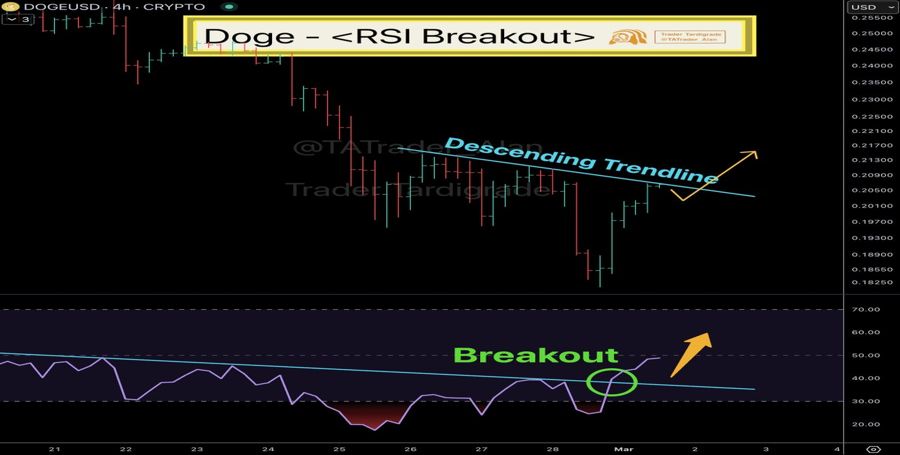
Technical analyst Trader Tardigrade observes a significant RSI breakout on the four-hour chart. The RSI, previously trending downward, has crossed above its resistance line, exceeding the 40 level. This signals increased bullish momentum. Historically, such RSI breakouts often precede shifts in price action, suggesting growing buyer control.
テクニカルアナリストのトレーダーであるTardigradeは、4時間のチャートで重要なRSIブレイクアウトを観察しています。 以前は下向きにトレンドしたRSIは、40レベルを超えて抵抗線を超えています。これは、強気の勢いを増加させました。 歴史的に、このようなRSIのブレイクアウトは、価格アクションのシフトに先行することが多く、買い手の制御の成長を示唆しています。
Source: Trader Tardigrade
出典:Traderの遅刻
This RSI breakout has spurred a price push towards the descending trendline resistance. A successful break above this resistance could trigger further upward movement. Conversely, failure to break through could lead to a pullback or extended consolidation. Market participants are keenly watching this crucial level to gauge Dogecoin's next move.
このRSIブレイクアウトは、下降するトレンドラインの抵抗に向かって価格を押し進めました。 この抵抗を上回る成功した休憩は、さらに上向きの動きを引き起こす可能性があります。逆に、突破しないと、プルバックまたは拡張統合につながる可能性があります。 市場の参加者は、この重要なレベルを鋭く見て、Dogecoinの次の動きを測定しています。
Falling Wedge Pattern and Impending Price Change
落ち着いたウェッジパターンと差し迫った価格の変化
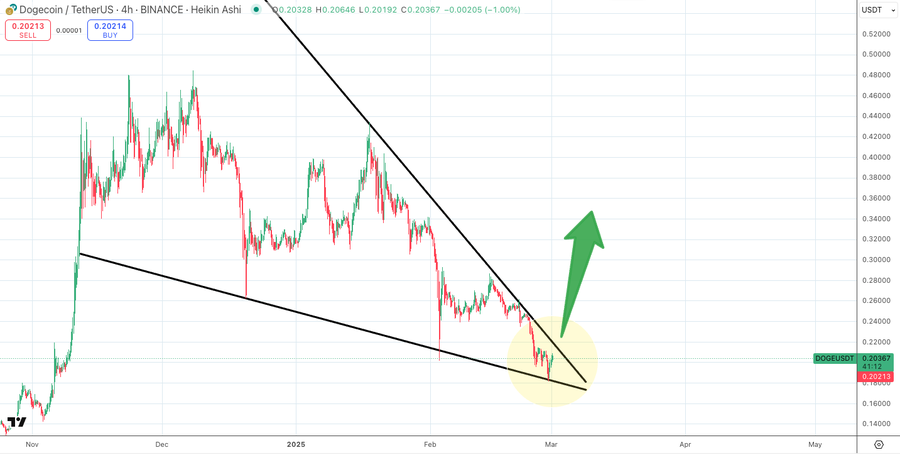
Another market observer, Satoshi Flipper, identifies a falling wedge pattern forming on Dogecoin's chart. The price is approaching the wedge's apex, characterized by two converging trendlines. Historically, falling wedges precede significant price breakouts. The narrowing price range indicates decreasing volatility, often a precursor to a substantial price change.
別のマーケットオブザーバー、サトシフリッパーは、Dogecoinのチャートに形成された落下ウェッジパターンを特定しています。 価格は、2つの収束トレンドラインを特徴とするウェッジの頂点に近づいています。 歴史的に、落下するウェッジは大幅な価格のまたがっています。価格帯を狭くすることは、ボラティリティの低下を示しています。これは、多くの場合、大幅な価格の変化の前兆です。
Source: Satoshi Flipper
出典:Satoshi Flipper
Dogecoin's price is currently hovering around $0.20213, a level acting as both support and resistance within the lower boundary of the falling wedge. A reversal at this level could lead to further consolidation. However, a decisive break above this resistance could ignite a bullish rally. Analysts emphasize that the market remains at a critical juncture, and subsequent price action will depend heavily on how it interacts with these key technical levels.
Dogecoinの価格は現在、約0.20213ドルであり、下降ウェッジの下限内でサポートとレジスタンスの両方として機能しています。 このレベルでの逆転は、さらなる統合につながる可能性があります。しかし、この抵抗を上回る決定的な休憩は、強気の集会に火をつける可能性があります。 アナリストは、市場が重要な時期のままであることを強調しており、その後の価格アクションは、これらの主要な技術レベルとの相互作用に大きく依存します。
 DogeHome
 Crypto News Land
 IT Times
 suncrypto.in
 Cryptos Newss
 Optimisus
 Thecoinrepublic.com


