

Dogecoin's price has been testing crucial support levels, hinting at a potential trend reversal. Technical analysis suggests the meme coin may break its current bearish trend, with several indicators pointing towards a bullish move.
Dogecoinの価格は、重要なサポートレベルをテストしており、潜在的な傾向の逆転を示唆しています。 テクニカル分析によると、ミームコインは現在の弱気傾向を破る可能性があり、いくつかの指標が強気の動きを指していることを示唆しています。
Dogecoin Price Support and Potential Breakout
DogeCoinの価格サポートと潜在的なブレイクアウト
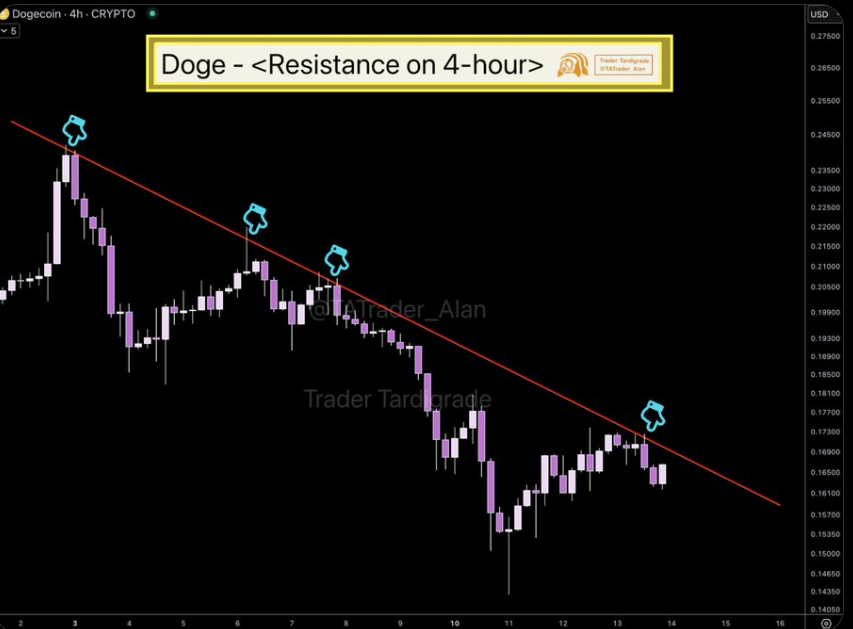
Dogecoin is currently trading steadily above the key support level of $0.16. Trader Tardigrade identifies this as a potential springboard for a bullish cycle. Despite recent minor price dips, the coin's ability to remain above this support suggests further gains are possible.
DogeCoinは現在、0.16ドルの主要なサポートレベルを着実に取引しています。 トレーダーの遅刻は、これを強気のサイクルの潜在的な踏み台であると特定しています。 最近のマイナーな価格の下落にもかかわらず、このサポートを超えるコインの能力は、さらなる利益が可能であることを示唆しています。
Importantly, Dogecoin is forming a multi-year ascending triangle, a chart pattern often preceding price breakouts. If Dogecoin surpasses its resistance at $0.17, Tardigrade predicts higher price levels and a trend reversal. This proximity to the resistance area has generated optimism regarding future price movements.
重要なことに、Dogecoinは複数年の上行の三角形を形成しています。 Dogecoinが抵抗を0.17ドルで超えた場合、Tardigradeはより高い価格レベルと傾向の逆転を予測します。抵抗領域へのこの近接性は、将来の価格の動きに関する楽観主義を生み出しました。
Stochastic RSI Crossover: A Bullish Signal
確率RSIクロスオーバー:強気信号
Another factor supporting a potential Dogecoin trend reversal is the imminent Stochastic RSI crossover. This indicator is crucial; a positive crossover often marks the beginning of a new bullish phase, as noted by analyst Ali Martinez.
潜在的なDogecoinの傾向逆転をサポートするもう1つの要因は、差し迫った確率的RSIクロスオーバーです。 このインジケータは非常に重要です。アナリストのアリ・マルティネスが指摘しているように、ポジティブなクロスオーバーはしばしば新しい強気段階の始まりを示しています。
Historical data shows that past Stochastic RSI crossovers have frequently preceded Dogecoin price rallies.
歴史的データは、過去の確率的RSIクロスオーバーがDogecoinの価格上昇に先行することが多いことを示しています。
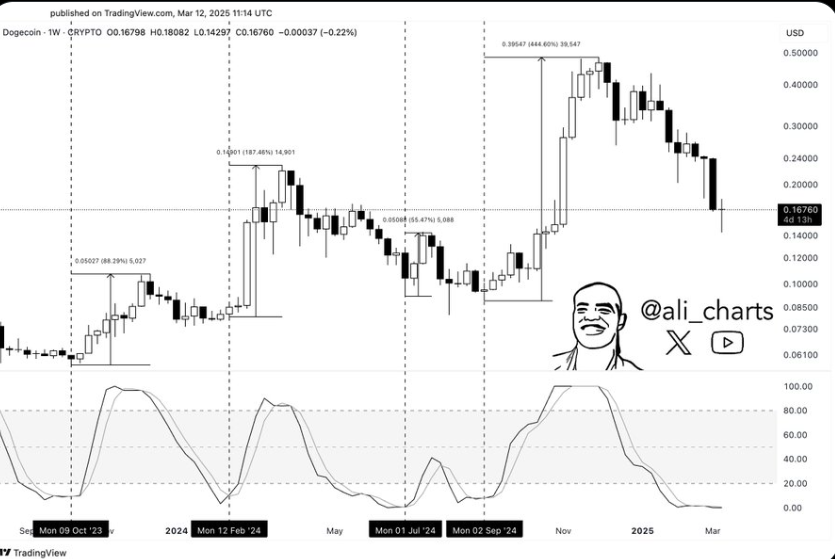
The Stochastic RSI is a momentum oscillator measuring the RSI's position within its price range over a specific period. A crossover, where the RSI line surpasses a certain threshold, signals potential upward price movement. A bullish crossover on the weekly timeframe could trigger a sharp Dogecoin rally, mirroring past events that resulted in price increases of 88%, 187%, and 444%. This indicator's significance keeps traders and analysts keenly observant.
確率的RSIは、特定の期間にわたる価格帯内のRSIの位置を測定する勢い発振器です。 RSIラインが特定のしきい値を上回るクロスオーバーは、潜在的な上昇価格の動きを示します。 毎週の時間枠での強気なクロスオーバーは、鋭いDogecoin Rallyを引き起こす可能性があり、88%、187%、および444%の価格上昇をもたらした過去のイベントを反映しています。 この指標の重要性により、トレーダーとアナリストが鋭く遵守されます。
Increased Dogecoin Network Activity
Dogecoinネットワークアクティビティの増加
Beyond technical indicators, increased Dogecoin network activity further supports a potential trend reversal. New addresses on the Dogecoin blockchain have grown by over 100% in the past month.
技術的指標を超えて、Dogecoinネットワークアクティビティの増加は、潜在的な傾向の逆転をさらにサポートします。 Dogecoinブロックチェーンの新しいアドレスは、過去1か月で100%以上増加しました。
This surge in on-chain activity suggests renewed interest in Dogecoin, potentially fueling further price increases. The rise in new addresses indicates improved market sentiment and investor participation, implying increased user engagement – whether through buying, holding, or other uses. This increased engagement could provide the momentum needed to break through resistance levels and initiate a bullish trend.
この鎖の活動のこの急増は、ドゲコインへの新たな関心を示唆しており、さらなる価格の上昇を促進する可能性があります。 新しい住所の増加は、市場の感情と投資家への参加が改善されたことを示しており、購入、保有、またはその他の用途を通じて、ユーザーエンゲージメントの増加を意味します。この増加するエンゲージメントは、抵抗レベルを突破し、強気の傾向を開始するために必要な勢いを提供する可能性があります。
At the time of writing, Dogecoin was trading at $0.1693, up 0.32% in the last 24 hours.
執筆時点で、Dogecoinは過去24時間で0.32%増加して0.1693ドルで取引されていました。
 DogeHome
 Crypto News Land
 IT Times
 suncrypto.in
 Cryptos Newss
 Optimisus
 Thecoinrepublic.com


