

Dogecoin's price has been testing crucial support levels, hinting at a potential trend reversal. Technical analysis suggests the meme coin may break its current bearish trend, with several indicators pointing towards a bullish move.
Dogecoin의 가격은 중요한 지원 수준을 테스트하여 잠재적 인 추세 반전을 암시하고 있습니다. 기술적 인 분석에 따르면 Meme Coin은 현재 약세 추세를 깨뜨릴 수 있으며 몇 가지 지표가 낙관적 인 움직임을 향하고 있습니다.
Dogecoin Price Support and Potential Breakout
Dogecoin 가격 지원 및 잠재적 탈주
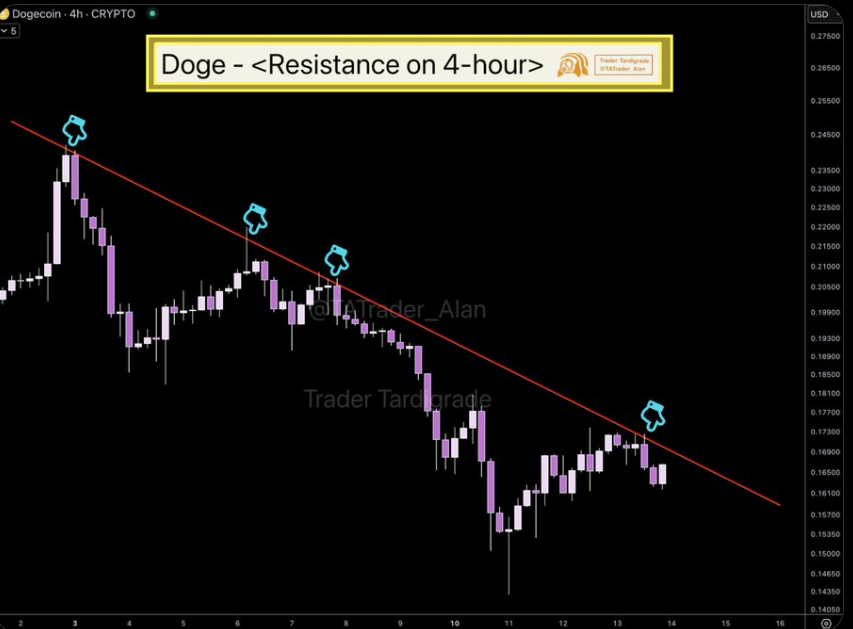
Dogecoin is currently trading steadily above the key support level of $0.16. Trader Tardigrade identifies this as a potential springboard for a bullish cycle. Despite recent minor price dips, the coin's ability to remain above this support suggests further gains are possible.
Dogecoin은 현재 $ 0.16의 주요 지원 수준보다 꾸준히 거래되고 있습니다. 상인 Tardigrade는 이것을 강세주기의 잠재적 인 발판으로 식별합니다. 최근의 사소한 가격 딥에도 불구하고, 동전 의이 지원을 넘어서는 능력은 추가 이익이 가능하다는 것을 시사합니다.
Importantly, Dogecoin is forming a multi-year ascending triangle, a chart pattern often preceding price breakouts. If Dogecoin surpasses its resistance at $0.17, Tardigrade predicts higher price levels and a trend reversal. This proximity to the resistance area has generated optimism regarding future price movements.
중요하게도, Dogecoin은 다년간의 오름차순 삼각형을 형성하고 있으며, 이는 종종 가격 소동 이전에 차트 패턴입니다. Dogecoin이 $ 0.17로 저항을 능가한다면 Tardigrade는 더 높은 가격 수준과 추세 반전을 예측합니다. 이러한 저항 영역과의 근접성은 미래의 가격 변동과 관련하여 낙관론을 생성했습니다.
Stochastic RSI Crossover: A Bullish Signal
확률 론적 RSI 크로스 오버 : 낙관적 신호
Another factor supporting a potential Dogecoin trend reversal is the imminent Stochastic RSI crossover. This indicator is crucial; a positive crossover often marks the beginning of a new bullish phase, as noted by analyst Ali Martinez.
잠재적 인 Dogecoin 트렌드 반전을 지원하는 또 다른 요인은 임박한 확률 론적 RSI 크로스 오버입니다. 이 표시기는 중요합니다. 긍정적 인 크로스 오버는 종종 분석가 알리 마르티네즈 (Ali Martinez)가 언급 한 바와 같이 새로운 강세 단계의 시작을 나타냅니다.
Historical data shows that past Stochastic RSI crossovers have frequently preceded Dogecoin price rallies.
역사적 데이터에 따르면 과거 확률 론적 RSI 크로스 오버는 종종 Dogecoin Price Rallies보다 우선합니다.
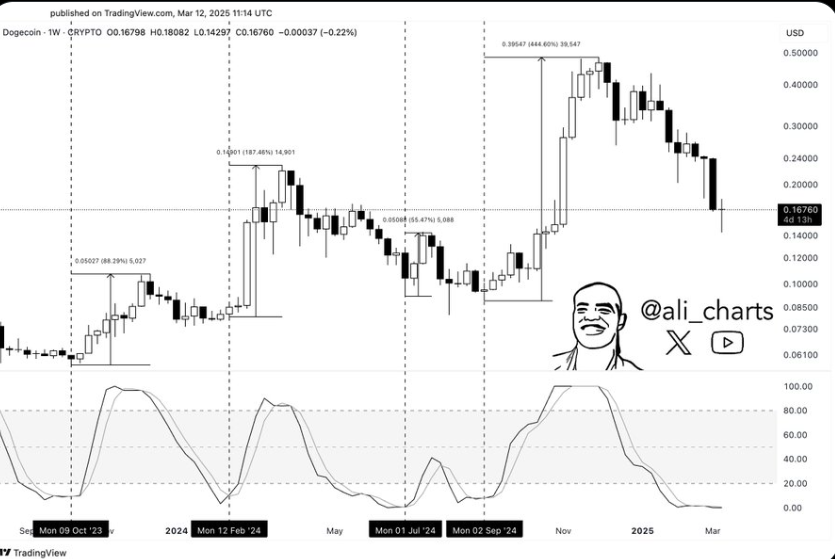
The Stochastic RSI is a momentum oscillator measuring the RSI's position within its price range over a specific period. A crossover, where the RSI line surpasses a certain threshold, signals potential upward price movement. A bullish crossover on the weekly timeframe could trigger a sharp Dogecoin rally, mirroring past events that resulted in price increases of 88%, 187%, and 444%. This indicator's significance keeps traders and analysts keenly observant.
확률 론적 RSI는 특정 기간 동안 가격 범위 내에서 RSI의 위치를 측정하는 모멘텀 발진기입니다. RSI 라인이 특정 임계 값을 능가하는 크로스 오버는 잠재적 인 상승 가격 이동의 신호를 보냅니다. 주간 기간 동안의 낙관적 인 크로스 오버는 날카로운 도구 랠리를 유발하여 과거의 사건을 반영하여 가격이 88%, 187%및 444%증가했습니다. 이 지표의 중요성은 거래자와 분석가가 예리하게 관찰합니다.
Increased Dogecoin Network Activity
Dogecoin 네트워크 활동 증가
Beyond technical indicators, increased Dogecoin network activity further supports a potential trend reversal. New addresses on the Dogecoin blockchain have grown by over 100% in the past month.
기술 지표 외에도 DogeCoin 네트워크 활동이 증가하면 잠재적 인 추세 반전이 추가로 지원됩니다. Dogecoin 블록 체인의 새로운 주소는 지난 달에 100% 이상 증가했습니다.
This surge in on-chain activity suggests renewed interest in Dogecoin, potentially fueling further price increases. The rise in new addresses indicates improved market sentiment and investor participation, implying increased user engagement – whether through buying, holding, or other uses. This increased engagement could provide the momentum needed to break through resistance levels and initiate a bullish trend.
이 체인 활동의 급증은 Dogecoin에 대한 새로운 관심을 암시하여 잠재적으로 추가 가격 인상을 불러 일으 킵니다. 새로운 주소의 증가는 시장 감정 및 투자자 참여가 향상되어 구매, 보유 또는 기타 용도 등 사용자 참여가 증가 함을 나타냅니다. 이러한 증가 된 참여는 저항 수준을 뚫고 낙관적 인 추세를 시작하는 데 필요한 추진력을 제공 할 수 있습니다.
At the time of writing, Dogecoin was trading at $0.1693, up 0.32% in the last 24 hours.
글을 쓰는 시점에서 Dogecoin은 지난 24 시간 동안 0.1693 달러로 0.32% 증가했습니다.
 DogeHome
 Crypto News Land
 IT Times
 suncrypto.in
 Cryptos Newss
 Optimisus
 Thecoinrepublic.com


