

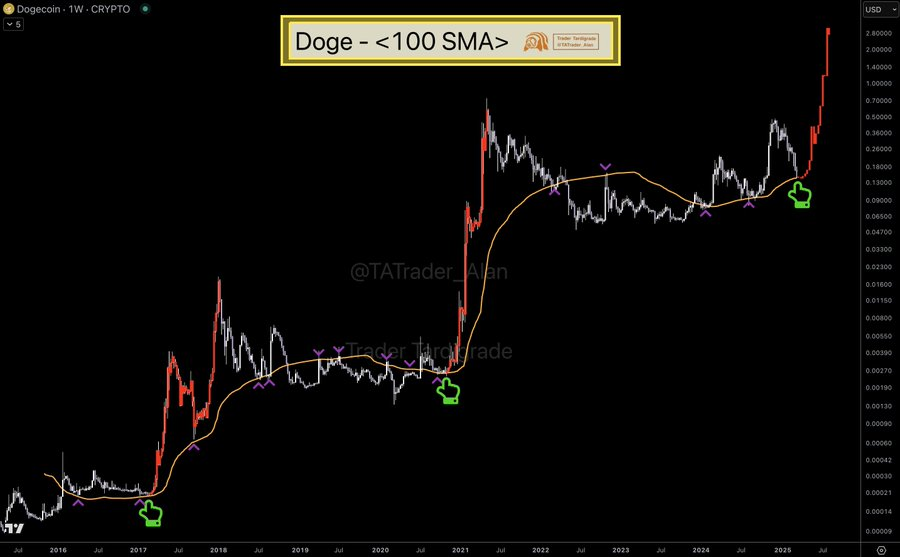
Dogecoin has repeatedly bounced off its 100-day Simple Moving Average (SMA), demonstrating consistent support prior to significant price increases. The 100-day SMA has historically been a crucial level for Dogecoin, often preceding breakouts after periods of consolidation. Defying this SMA has frequently resulted in sharp rallies and renewed momentum.
Dogecoinは、100日間の単純移動平均(SMA)を繰り返し跳ね返し、大幅な価格上昇の前に一貫したサポートを示しています。 100日間のSMAは、歴史的にDogecoinにとって重要なレベルであり、しばしば統合期間後にブレイクアウトに先行していました。 このSMAに逆らうことは、頻繁に鋭い集会と新たな勢いをもたらしました。
Dogecoin's price action also shows significant interaction with the 100-week SMA, mirroring past trends of strong breakouts. The cryptocurrency has previously tested this level before experiencing major price rallies, making its recent interaction noteworthy.
Dogecoinの価格アクションは、100週間のSMAとの大幅な相互作用も示しており、過去の強いブレイクアウトのトレンドを反映しています。 暗号通貨は、主要な価格上昇を経験する前に以前にこのレベルをテストしており、最近の相互作用が注目に値します。
Historical Interaction with the 100 SMA
100 SMAとの歴史的相互作用
Dogecoin's price history reveals numerous instances of consolidation and subsequent breakouts after encountering the 100 SMA. Before its 2017 upward trend, the price resided below this moving average. Similar patterns emerged in 2020, preceding a substantial rally extending into 2021.
Dogecoinの価格履歴は、100 SMAに遭遇した後、統合とその後のブレイクアウトの多くのインスタンスを明らかにしています。 2017年の上昇傾向の前に、価格はこの移動平均を下回っていました。 同様のパターンが2020年に出現し、2021年までの実質的な集会に先立ちました。
Before significant uptrends in 2022 and 2023, the price fluctuated around and returned to the 100 SMA. This repeated interaction highlights the SMA's role as a support level before price acceleration. Each consolidation phase near this moving average has foreshadowed notable price surges.
2022年と2023年に大幅に上昇する前に、価格は変動し、100 SMAに戻りました。この繰り返しの相互作用は、価格加速前のサポートレベルとしてのSMAの役割を強調しています。 この移動平均近くの各統合フェーズは、顕著な価格の急増を予見しています。
Recent Market Developments
最近の市場開発
Technical analyst Trader Tardigrade observed Dogecoin's recent (2024) retest of the 100 SMA. Past behavior suggests that touching this level often precedes strong upward momentum. The analyst's chart includes green markers highlighting key points where Dogecoin successfully rebounded from the SMA.
テクニカルアナリストのトレーダーであるTardigradeは、Dogecoinの最近の(2024)100 SMAの再テストを観察しました。 過去の行動は、このレベルに触れることはしばしば強い上方の勢いに先行することを示唆しています。 アナリストのチャートには、DogecoinがSMAからうまくリバウンドしたキーポイントを強調する緑色のマーカーが含まれています。
Source: Trader Tardigrade
出典:Traderの遅刻
Purple markers, according to Tardigrade, represent resistance points where the price temporarily stalled before establishing a clear directional trend. Each approach to the moving average showed accumulation phases preceding breakouts. Historical patterns strongly suggest this level's significance in market movements.
紫色のマーカーは、遅延gigradeによれば、明確な方向性トレンドを確立する前に価格が一時的に失速した抵抗点を表しています。 移動平均への各アプローチは、ブレイクアウトの前に蓄積段階を示しました。 歴史的パターンは、市場の動きにおけるこのレベルの重要性を強く示唆しています。
Market Outlook
市場の見通し
Dogecoin's current price action aligns with historical patterns, where testing the 100 SMA potentially precedes a price increase. The market has previously seen extended consolidation at this level before breakouts. If this pattern repeats, a strong uptrend could follow. Market participants are closely monitoring Dogecoin's price behavior to determine if the historical correlation with the 100 SMA remains valid. Future price action will ultimately confirm whether another rally follows this latest test of the moving average.
Dogecoinの現在の価格アクションは、100 SMAのテストが価格上昇に先行する可能性がある歴史的パターンと一致しています。 市場では、ブレイクアウト前のこのレベルでの統合が延長されたことが以前に見られました。 このパターンが繰り返されると、強力なアップトレンドが続く可能性があります。市場参加者は、Dogecoinの価格行動を綿密に監視し、100 SMAとの歴史的な相関が有効であるかどうかを判断しています。 将来の価格アクションは、最終的に別のラリーが移動平均のこの最新のテストに続くかどうかを確認します。
 CoinPedia News
 CoinoMedia
 DogeHome
 Optimisus
 Coin Edition
 crypto.news
 Cryptopolitan_News
 Optimisus


