

Dogecoin's price history exhibits a recurring pattern: significant rallies followed by substantial pullbacks. Past recoveries from these pullbacks have resulted in considerable market gains.
A long-term support trendline has consistently attracted buying interest, acting as a significant factor influencing Dogecoin's future price trajectory. Maintaining a price above this support level would signal strength and an upward trend; conversely, a break below could indicate long-term losses and a bearish market.
Dogecoin's price volatility is notable, characterized by strong rallies followed by steep declines. Recent market trends highlight the importance of key support levels and predictable pullback behavior, making it an asset of interest to traders.
Repeated Market Pullbacks and Price Surges
Trader Tardigrade's analysis identifies three corrections Dogecoin experienced since October 2022: a 64% correction from October 2022 to June 2023 followed by a 300% surge; a subsequent 64% correction from March 2024 to August 2024 followed by a 500% increase; and a 66% correction from December 2024 to March 2025.
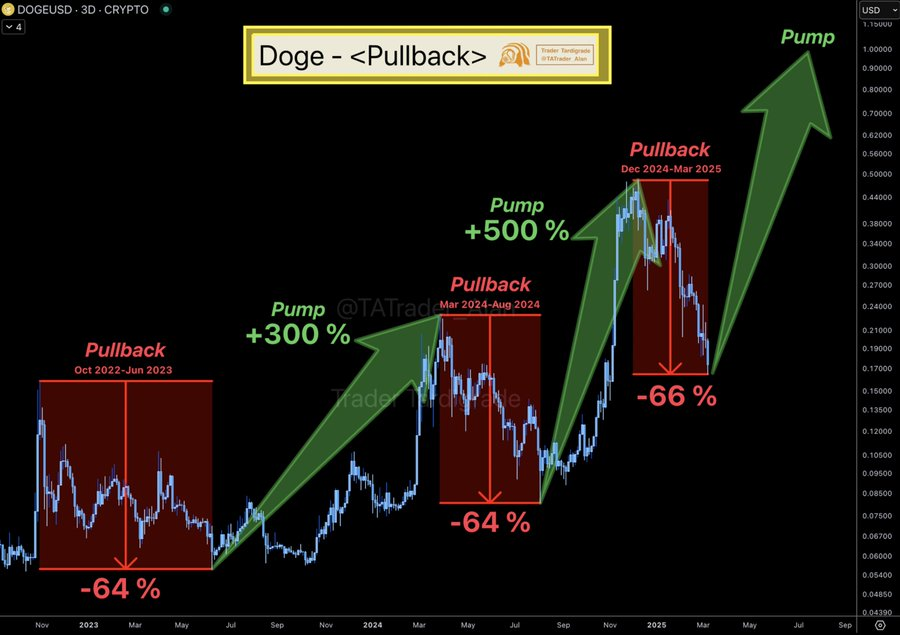
Source: Trader Tardigrade
Each cycle demonstrates a consistent pattern: rapid gains followed by corrections before price stabilization. Dogecoin's ability to recover from these losses suggests an established growth pattern driven by volatility. If this pattern continues, another rally could follow after March 2025, potentially leading to new highs or solidifying stronger long-term support.
Long-Term Support Trendline Remains Crucial
Trader Tardigrade's analysis highlights Dogecoin's consistent reaction to a long-term support trendline. This trendline has repeatedly triggered increased buying activity, indicating strong demand at these price levels.
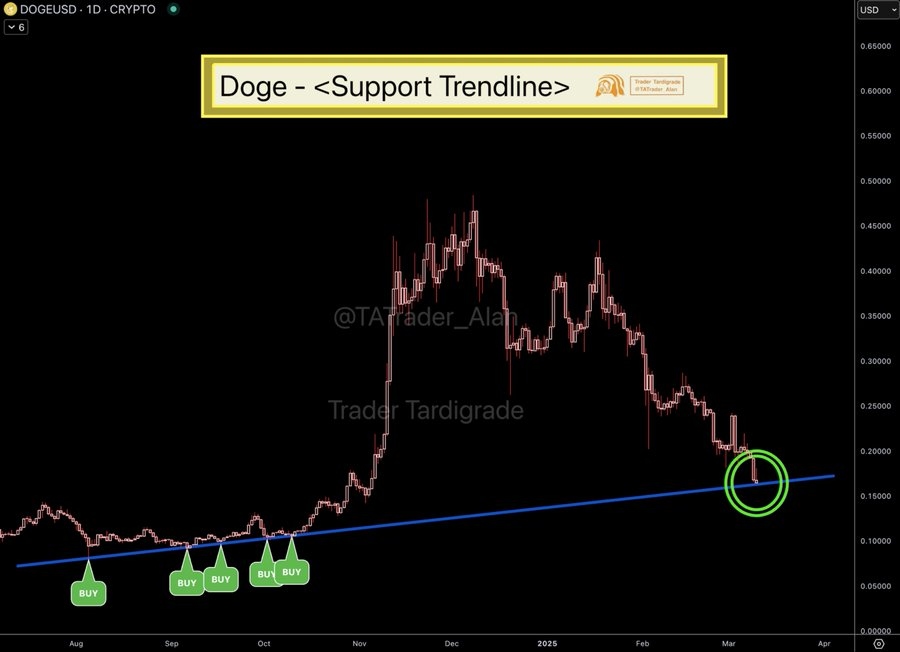
Source: Trader Tardigrade
Dogecoin has historically bounced off this support line before embarking on upward trends, reaching new highs before subsequent corrections. Recent price movements show Dogecoin testing this level again (indicated by a green circle in the analysis). If historical trends repeat, this could signal another potential recovery.
Maintaining a price above this key support level would suggest stabilization and continued upward momentum. Conversely, a drop below this level could initiate a long-term bearish trend. This trendline serves as a critical reference point for traders anticipating Dogecoin's next move, offering insights into potential future price movements.
 Cryptopolitan_News
 TheCoinrise Media
 BlockchainReporter
 DogeHome
 Optimisus
 CFN
CFN Optimisus
 BlockchainReporter
 CFN
CFN


