

Dogecoin's price history exhibits a recurring pattern: significant rallies followed by substantial pullbacks. Past recoveries from these pullbacks have resulted in considerable market gains.
Dogecoinの価格履歴は、繰り返しのパターンを示しています。それに続いて大幅なプルバックが続きます。 これらのプルバックからの過去の回復は、かなりの市場利益をもたらしました。
A long-term support trendline has consistently attracted buying interest, acting as a significant factor influencing Dogecoin's future price trajectory. Maintaining a price above this support level would signal strength and an upward trend; conversely, a break below could indicate long-term losses and a bearish market.
長期的なサポートのトレンドラインは、一貫して購入利息を引き付けており、Dogecoinの将来の価格軌道に影響を与える重要な要因として機能しています。 このサポートレベルを超える価格を維持すると、強度と上昇傾向が示されます。逆に、以下の休憩は、長期的な損失と弱気市場を示している可能性があります。
Dogecoin's price volatility is notable, characterized by strong rallies followed by steep declines. Recent market trends highlight the importance of key support levels and predictable pullback behavior, making it an asset of interest to traders.
Dogecoinの価格のボラティリティは注目に値し、強い集会に続いて急な減少が特徴です。最近の市場動向は、主要なサポートレベルと予測可能なプルバック動作の重要性を強調しており、トレーダーにとって関心のある資産となっています。
Repeated Market Pullbacks and Price Surges
繰り返し市場のプルバックと価格の急増
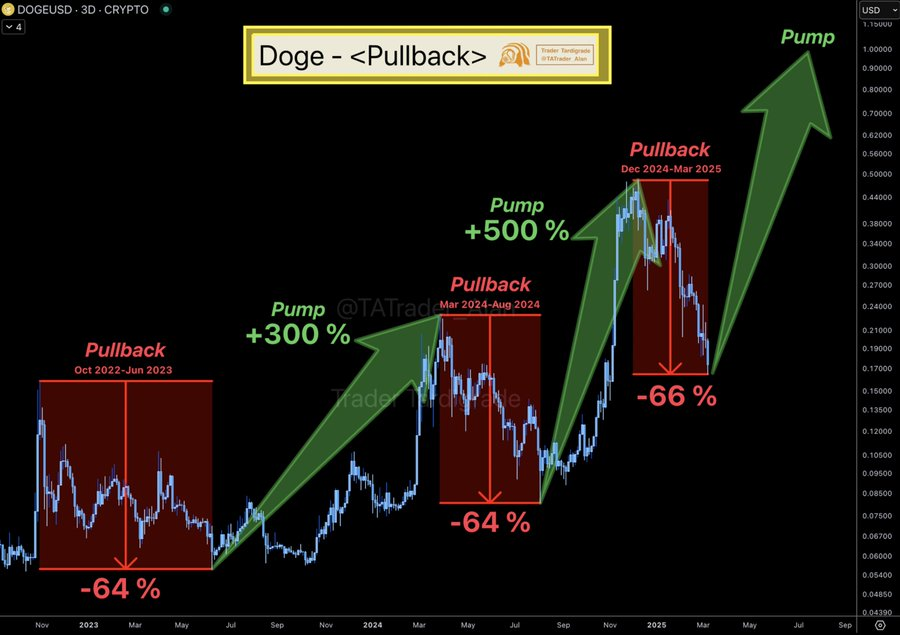
Trader Tardigrade's analysis identifies three corrections Dogecoin experienced since October 2022: a 64% correction from October 2022 to June 2023 followed by a 300% surge; a subsequent 64% correction from March 2024 to August 2024 followed by a 500% increase; and a 66% correction from December 2024 to March 2025.
Trader Tardigradeの分析では、2022年10月以降にDogecoinが経験した3つの修正が特定されています。2022年10月から2023年6月までの64%の修正に続いて300%の急増が行われます。 2024年3月から2024年8月までの64%の修正に続いて500%増加しました。 2024年12月から2025年3月までの66%の修正。
Source: Trader Tardigrade
出典:Traderの遅刻
Each cycle demonstrates a consistent pattern: rapid gains followed by corrections before price stabilization. Dogecoin's ability to recover from these losses suggests an established growth pattern driven by volatility. If this pattern continues, another rally could follow after March 2025, potentially leading to new highs or solidifying stronger long-term support.
各サイクルは、一貫したパターンを示しています。急速な利益に続いて、価格安定化前の修正が続きます。 これらの損失から回復するDogecoinの能力は、ボラティリティによって駆動される確立された成長パターンを示唆しています。 このパターンが続くと、2025年3月以降に別の集会が続く可能性があり、新しい高値につながる可能性があるか、より強力な長期サポートを固めます。
Long-Term Support Trendline Remains Crucial
長期的なサポートトレンドラインは依然として重要です
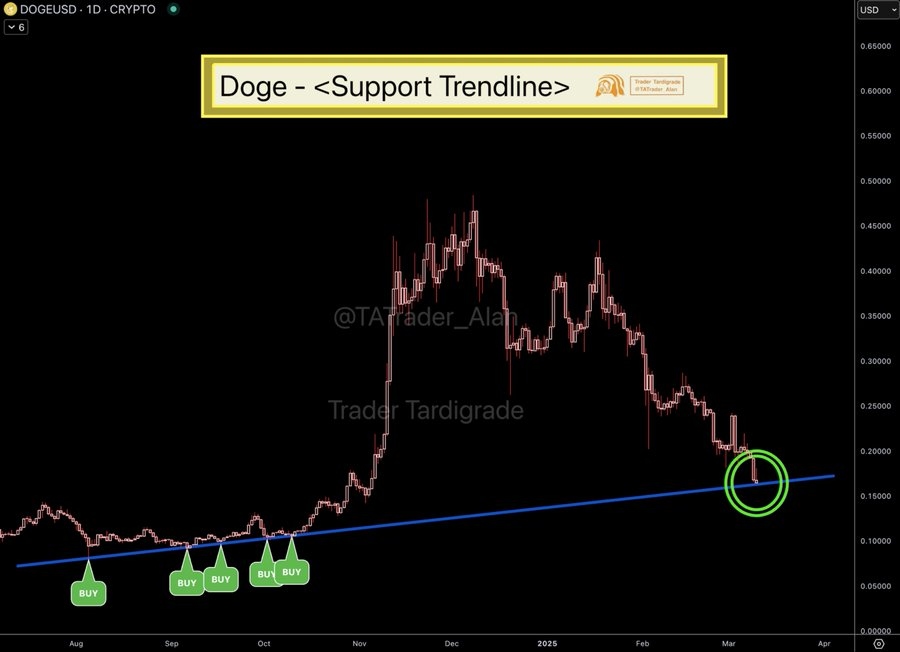
Trader Tardigrade's analysis highlights Dogecoin's consistent reaction to a long-term support trendline. This trendline has repeatedly triggered increased buying activity, indicating strong demand at these price levels.
Trader Tardigradeの分析は、長期的なサポートトレンドラインに対するDogecoinの一貫した反応を強調しています。 このトレンドラインは、購入活動の増加を繰り返し引き起こし、これらの価格レベルで強い需要を示しています。
Source: Trader Tardigrade
出典:Traderの遅刻
Dogecoin has historically bounced off this support line before embarking on upward trends, reaching new highs before subsequent corrections. Recent price movements show Dogecoin testing this level again (indicated by a green circle in the analysis). If historical trends repeat, this could signal another potential recovery.
Dogecoinは、上昇傾向に着手する前に、このサポートラインから歴史的に跳ね返り、その後の修正の前に新しい高値に達しました。 最近の価格の動きは、このレベルを再度テストするDogecoinを示しています(分析の緑の円で示されています)。 歴史的傾向が繰り返されると、これは別の潜在的な回復を示す可能性があります。
Maintaining a price above this key support level would suggest stabilization and continued upward momentum. Conversely, a drop below this level could initiate a long-term bearish trend. This trendline serves as a critical reference point for traders anticipating Dogecoin's next move, offering insights into potential future price movements.
この主要なサポートレベルを超える価格を維持すると、安定化が示唆され、上向きの勢いが続きます。 逆に、このレベルを下回ると、長期的な弱気傾向が開始される可能性があります。このトレンドラインは、Dogecoinの次の動きを予測するトレーダーにとって重要な基準点として機能し、潜在的な将来の価格の動きに関する洞察を提供します。
 Cryptopolitan_News
 TheCoinrise Media
 BlockchainReporter
 DogeHome
 Optimisus
 CFN
CFN Optimisus
 BlockchainReporter
 CFN
CFN


