

Technical indicators suggest a potential Dogecoin (DOGE) price rally after reclaiming $0.22. A breakout above $0.22 could be amplified by approximately $644 million in leveraged long positions at risk.
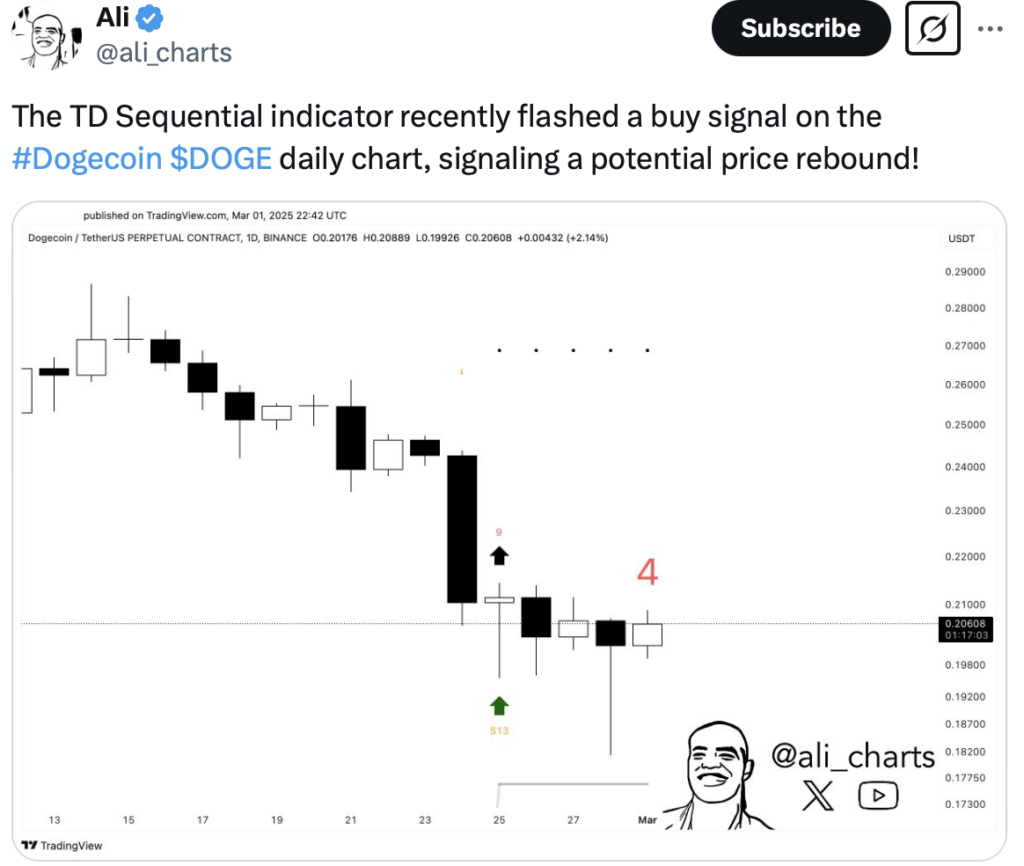
TD Sequential Indicator Suggests Rebound
The TD Sequential indicator flashed a buy signal on Dogecoin's daily timeframe, suggesting exhaustion of the current trend. This pattern often precedes price rallies, indicating a potential weakening of selling pressure. The indicator's proven track record in identifying key Dogecoin price reversals makes it a popular tool among traders.
Coinglass data reveals approximately $644 million in liquidation positions around the $0.21 price level. This presents the possibility of a short squeeze, potentially prompting traders with bearish positions to close them if Dogecoin breaks through the $0.21 resistance. Sustaining an upward trend requires buyers to push the price above the $0.22 resistance zone, a level showing high concentration according to heatmap analysis.
Dogecoin Price Technical Analysis and Market Outlook
The four-hour timeframe shows a minor upward correction, according to technical analysis. However, the price remains below both the 50-period (red) and 100-period (blue) exponential moving averages (EMAs), indicating a prevailing bearish trend. The recent price increase above these moving averages suggests either a potential trend reversal or a temporary rebound. The price experienced a brief pullback, finding support at the former resistance level near $0.24.
Bullish momentum could resume if the current price level holds, potentially pushing DOGE towards the $0.26 resistance. Conversely, a failure to maintain support at $0.22 could lead to a price decline. The Awesome Oscillator has turned green, displaying strong upward momentum, supporting the recent price increase. However, sustained upward movement depends on buyers maintaining current gains.
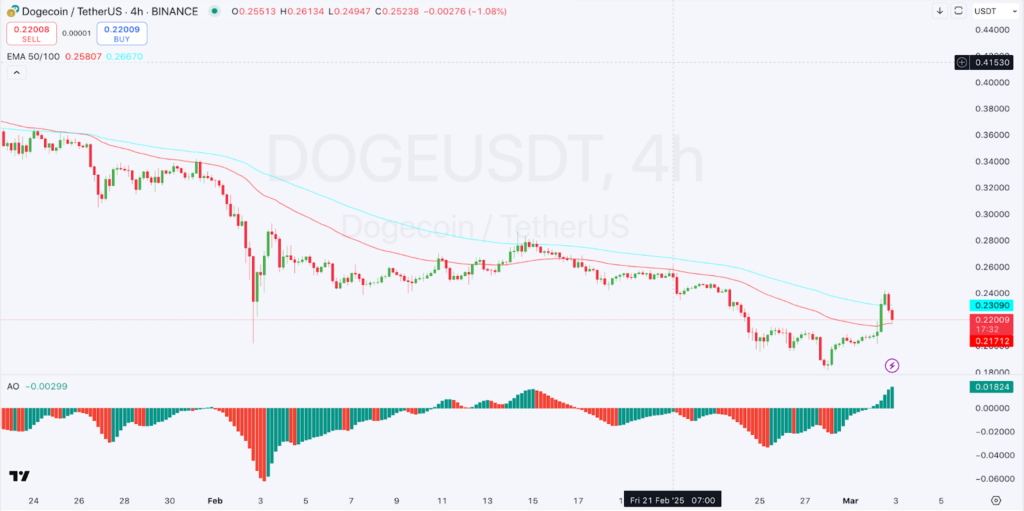
The price's proximity to the moving averages within a bearish trend, with the 50 EMA below the 100 EMA, requires further confirmation for a sustained uptrend. A "golden cross" (50 EMA crossing above the 100 EMA) would significantly strengthen the bullish forecast.
DOGE Price Expectations
Key resistance levels for bulls lie at $0.26 and $0.28, areas of previous sell-offs. Retesting $0.22 and $0.21 could trigger further upward movement. DOGE is currently at a critical juncture; a breakout above resistance will shape its near-term trend, while a rejection will determine its next direction. Volume and further price action at key levels will ultimately dictate the market's next move.
 crypto.news
 DogeHome
 CFN
CFN Times Tabloid
 Thecoinrepublic.com
 Crypto News Land
 CoinPedia News


