

Technical indicators suggest a potential Dogecoin (DOGE) price rally after reclaiming $0.22. A breakout above $0.22 could be amplified by approximately $644 million in leveraged long positions at risk.
技術的指標は、0.22ドルを取り戻した後の潜在的なDogecoin(Doge)価格上昇を示唆しています。 0.22ドルを超えるブレイクアウトは、危険にさらされているレバレッジされたロングポジションで約6億4,400万ドルで増幅される可能性があります。
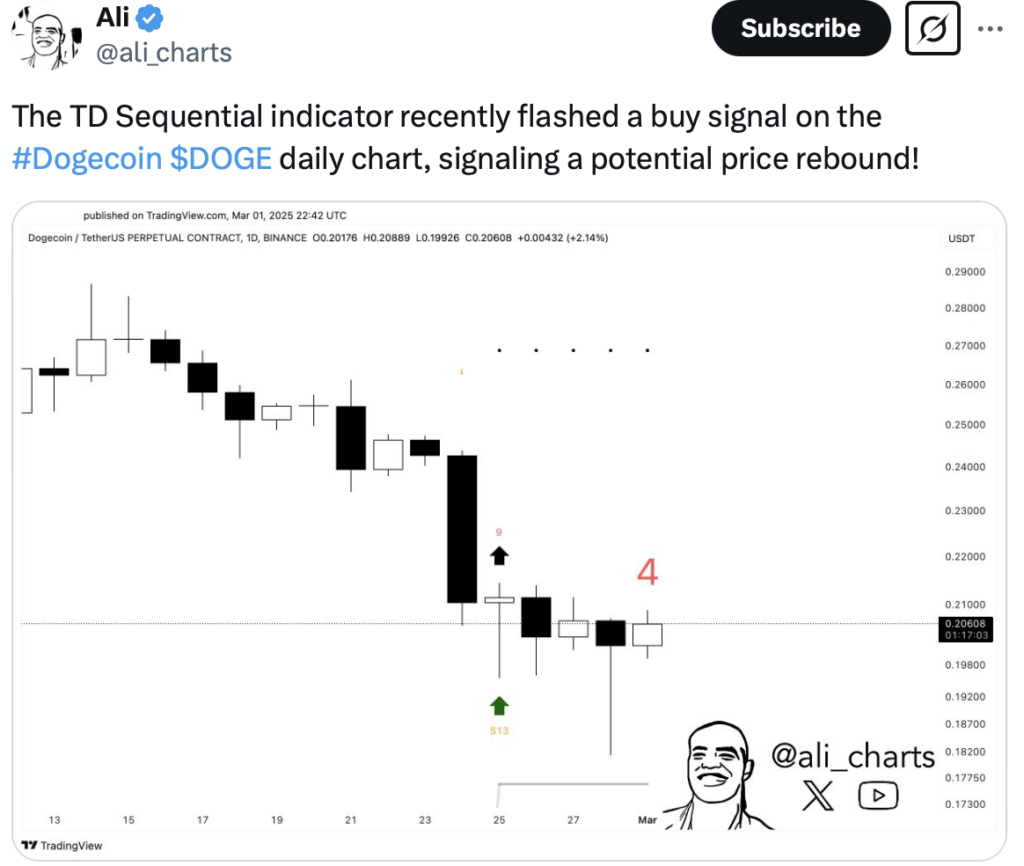
TD Sequential Indicator Suggests Rebound
TDシーケンシャルインジケーターはリバウンドを示唆しています
The TD Sequential indicator flashed a buy signal on Dogecoin's daily timeframe, suggesting exhaustion of the current trend. This pattern often precedes price rallies, indicating a potential weakening of selling pressure. The indicator's proven track record in identifying key Dogecoin price reversals makes it a popular tool among traders.
TDシーケンシャルインジケーターは、Dogecoinの毎日の時間枠で購入信号をフラッシュし、現在の傾向の疲労を示唆しています。このパターンはしばしば価格上昇に先行しており、販売圧力の潜在的な弱体化を示しています。 主要なDogecoin価格の逆転を特定する際のインジケーターの実績は、トレーダーの間で人気のあるツールになります。
Coinglass data reveals approximately $644 million in liquidation positions around the $0.21 price level. This presents the possibility of a short squeeze, potentially prompting traders with bearish positions to close them if Dogecoin breaks through the $0.21 resistance. Sustaining an upward trend requires buyers to push the price above the $0.22 resistance zone, a level showing high concentration according to heatmap analysis.
Coinglassのデータは、約0.21ドルの価格レベルを約6億4,400万ドルの清算ポジションで明らかにしています。 これは、短い絞りの可能性を示し、Dogecoinが0.21ドルの抵抗を破ると、弱気の位置を持つトレーダーがそれらを閉じるように促す可能性があります。 上昇傾向を維持するには、購入者が0.22ドルのレジスタンスゾーンを超える価格を押し上げる必要があります。これは、ヒートマップ分析に応じて高濃度を示すレベルです。
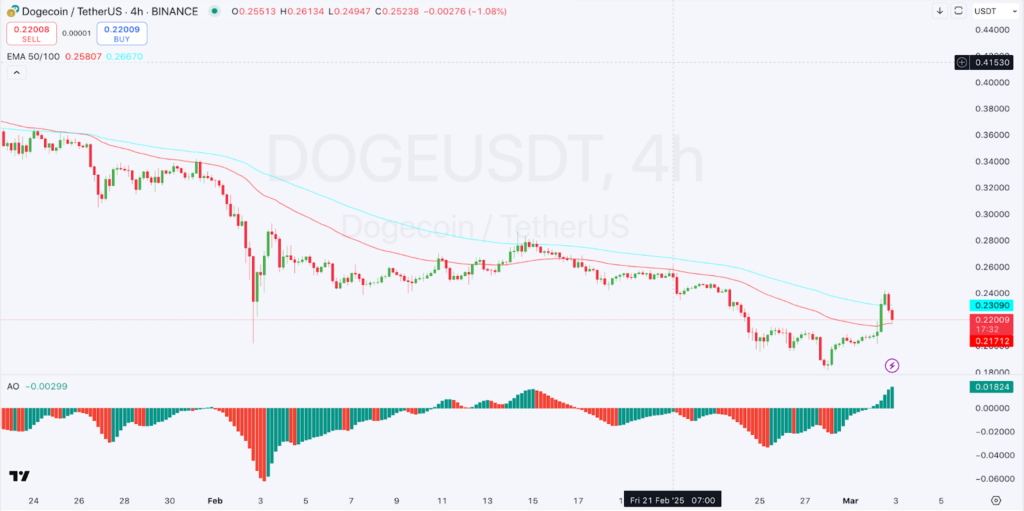
Dogecoin Price Technical Analysis and Market Outlook
Dogecoin価格のテクニカル分析と市場の見通し
The four-hour timeframe shows a minor upward correction, according to technical analysis. However, the price remains below both the 50-period (red) and 100-period (blue) exponential moving averages (EMAs), indicating a prevailing bearish trend. The recent price increase above these moving averages suggests either a potential trend reversal or a temporary rebound. The price experienced a brief pullback, finding support at the former resistance level near $0.24.
テクニカル分析によると、4時間の時間枠では、マイナーな上向きの修正が示されています。 ただし、価格は50期(赤)と100期(青)指数移動平均(EMA)の両方を下回っており、一般的な弱気傾向を示しています。これらの移動平均を上回る最近の価格上昇は、潜在的な傾向の逆転または一時的なリバウンドのいずれかを示唆しています。 価格は短いプルバックを経験し、0.24ドル近くの以前の抵抗レベルでサポートを見つけました。
Bullish momentum could resume if the current price level holds, potentially pushing DOGE towards the $0.26 resistance. Conversely, a failure to maintain support at $0.22 could lead to a price decline. The Awesome Oscillator has turned green, displaying strong upward momentum, supporting the recent price increase. However, sustained upward movement depends on buyers maintaining current gains.
強気の勢いは、現在の価格レベルが保持された場合に再開する可能性があり、潜在的にDogeが0.26ドルの抵抗に向かっている。 逆に、サポートを0.22ドルで維持できなかったため、価格の下落につながる可能性があります。 素晴らしい発振器は緑に変わり、強い上向きの勢いを示し、最近の価格上昇をサポートしています。 ただし、持続的な上向きの動きは、現在の利益を維持するバイヤーに依存します。
The price's proximity to the moving averages within a bearish trend, with the 50 EMA below the 100 EMA, requires further confirmation for a sustained uptrend. A "golden cross" (50 EMA crossing above the 100 EMA) would significantly strengthen the bullish forecast.
50 EMAが100 EMAの下にある、弱気傾向内の移動平均への価格の近接性には、持続的なアップトレンドのさらなる確認が必要です。 「ゴールデンクロス」(100 EMAの上に50 EMA交差する)は、強気の予測を大幅に強化します。
DOGE Price Expectations
Dogeの価格の期待
Key resistance levels for bulls lie at $0.26 and $0.28, areas of previous sell-offs. Retesting $0.22 and $0.21 could trigger further upward movement. DOGE is currently at a critical juncture; a breakout above resistance will shape its near-term trend, while a rejection will determine its next direction. Volume and further price action at key levels will ultimately dictate the market's next move.
雄牛の主要な抵抗レベルは、以前の売却のエリアである0.26ドルと0.28ドルです。 0.22ドルと0.21ドルを再テストすると、さらに上向きの動きがトリガーされる可能性があります。 Dogeは現在、重要な時期にあります。抵抗を上回るブレイクアウトは、その短期的な傾向を形成し、拒否は次の方向を決定します。 キーレベルでの量とさらなる価格アクションは、最終的に市場の次の動きを決定します。
 DogeHome
 CFN
CFN Times Tabloid
 Thecoinrepublic.com
 Crypto News Land
 CoinPedia News


