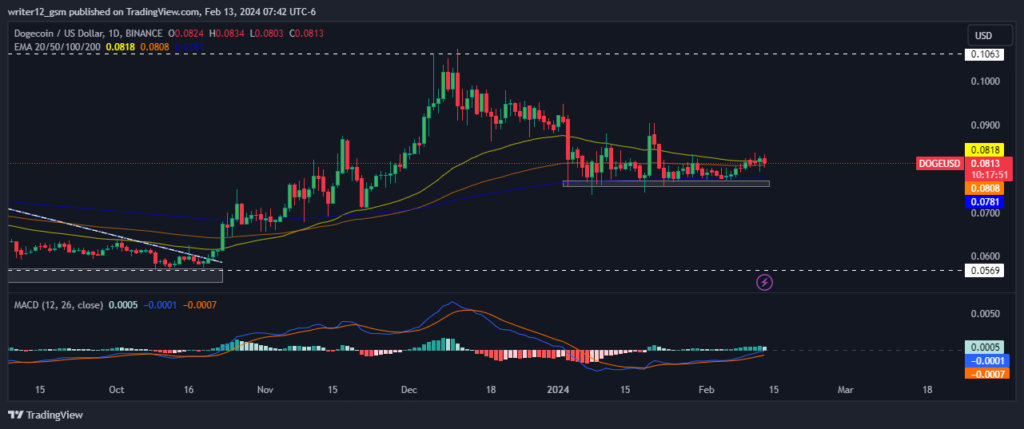
- 1 Dogecoin is looking bullish on the daily chart.
- 2 DOGE price broke above the key moving averages, showcasing bullish signals.
- 3 Buyers were aggressive in the previous trading sessions.
A massive Dogecoin transfer worth over $20 Million sparked curiosity in the crypto community. The transaction, which came from the popular U.S. broker Robinhood and went to an unknown wallet, was reported by Whale Alert, a platform that tracks large crypto movements.
The motive behind the transfer is unclear, but some may suspect that it involves institutional or wealthy investors who use Robinhood as a gateway to the crypto market. Moreover, news does not impact the price as much.
However, on the daily technical chart the price is trying to bounce back trying to break above the key moving averages.
At the current moment the crypto price is trading at 0.0817 with a intraday drop of 1.09% and a 24 hours volume of $418.43 Million. The current market cap of the DOGE is $11.62 Billion with a fully diluted market cap of $11.62 Billion. The current volume to market cap ratio is 0.0363 wit a circulating supply of $143.06 Billion.
The current scenario suggest traders and investors should be patient and wait for a clear break below or above the EMAs before making any moves and the fear of missing out to minimize losses.
The DOGE price at present requires substantial support from the buyers to make a recovery as it is facing major resistance from the previous resistance points and multiple moving average levels. Dogecoin bulls are pulling the price action into their grasp, according to the structural patterns.
Dogecoin Price On The Technical Chart

The price is currently trading above both the 50 and 20-Day EMAs, indicating strong selling pressure.
The Moving Average Convergence Divergence (MACD) line (blue) also supports the mild bullishness trend as it trades just above the signal line (orange). The histogram is in the positive, showing green bars slightly extending on the price.
However, the Relative Strength Index (RSI) is recovering from below the 30-oversold region, sitting at 51.01 and moving upward. A sustained push should make the RSI cross the 50 midline level.
Summary
The DOGE price analysis highlights mild bullishness in the crypto price on the daily technical chart. EMAs are supporting the price on the daily technical time frame chart. Moreover, crypto is currently facing selling pressure as it struggles to sustain its present level. Moreover, volume is up, but not enough to generate buying momentum. However, Dogecoin needs to attract more buyers to surge from the current level and start the recovery phase.
Technical Levels
Support Level: $0.0781
Resistance Level: $0.0907
Disclaimer
This article is for informational purposes only and provides no financial, investment, or other advice. The author or any people mentioned in this article are not responsible for any financial loss that may occur from investing in or trading. Please do your research before making any financial decisions.


 Optimisus
 Optimisus
 Optimisus
 Thecryptoupdates
 DogeHome
 The Crypto Times
 Coincu
 Optimisus
 Coin_Gabbar


