- 1 Dogecoin is looking bullish on the daily chart.
- 2 DOGE price broke above the key moving averages, showcasing bullish signals.
- 3 Buyers were aggressive in the previous trading sessions.
1 ドージコインは日足チャートでは強気に見えます。
2 DOGE 価格は主要な移動平均を上回り、強気のシグナルを示しました。
3 前回の取引セッションでは買い手が積極的でした。
A massive Dogecoin transfer worth over $20 Million sparked curiosity in the crypto community. The transaction, which came from the popular U.S. broker Robinhood and went to an unknown wallet, was reported by Whale Alert, a platform that tracks large crypto movements.
The motive behind the transfer is unclear, but some may suspect that it involves institutional or wealthy investors who use Robinhood as a gateway to the crypto market. Moreover, news does not impact the price as much.
2,000 万ドルを超える巨額のドージコイン送金は、暗号通貨コミュニティの好奇心を呼び起こしました。この取引は米国の人気ブローカー、ロビンフッドから送られ、未知のウォレットに送られたもので、大規模な仮想通貨の動きを追跡するプラットフォームであるホエール・アラートによって報告された。送金の背後にある動機は不明だが、機関投資家や富裕層が関与しているのではないかと疑う人もいるかもしれない。ロビンフッドを仮想通貨市場へのゲートウェイとして利用する投資家。さらに、ニュースは価格にそれほど影響を与えません。
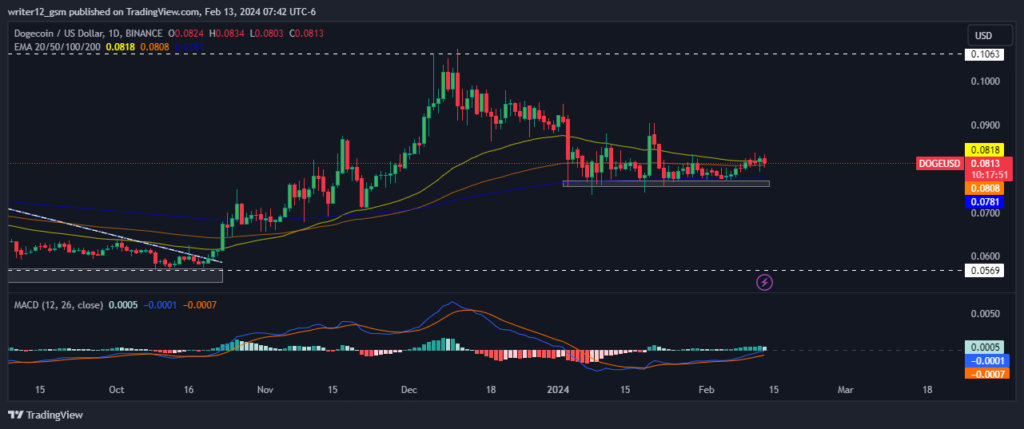
However, on the daily technical chart the price is trying to bounce back trying to break above the key moving averages.
しかし、日次テクニカルチャートでは、価格は主要な移動平均線を上抜けようとして反発しようとしています。
At the current moment the crypto price is trading at 0.0817 with a intraday drop of 1.09% and a 24 hours volume of $418.43 Million. The current market cap of the DOGE is $11.62 Billion with a fully diluted market cap of $11.62 Billion. The current volume to market cap ratio is 0.0363 wit a circulating supply of $143.06 Billion.
現時点で、仮想通貨価格は0.0817で取引されており、日中下落率は1.09%、24時間の出来高は4億1,843万ドルとなっています。 DOGE の現在の時価総額は 116 億 2000 万ドルで、完全希薄化後の時価総額は 116 億 2000 万ドルです。現在の出来高と時価総額の比率は 0.0363 で、流通供給量は 1,430 億 6,000 万ドルです。
The current scenario suggest traders and investors should be patient and wait for a clear break below or above the EMAs before making any moves and the fear of missing out to minimize losses.
現在のシナリオは、トレーダーと投資家が損失を最小限に抑えるために、行動を起こす前に辛抱強くEMAを下回るか上回る明確なブレイクを待つべきであること、そして損失を最小限に抑えるために逃すことを恐れるべきであることを示唆しています。
The DOGE price at present requires substantial support from the buyers to make a recovery as it is facing major resistance from the previous resistance points and multiple moving average levels. Dogecoin bulls are pulling the price action into their grasp, according to the structural patterns.
DOGE価格は現在、以前のレジスタンスポイントと複数の移動平均レベルからの大きな抵抗に直面しているため、回復するには買い手からの相当なサポートが必要です。ドージコインの強気派は、構造パターンに従って価格変動を自分たちの手中に収めています。
Dogecoin Price On The Technical Chart
テクニカルチャート上のドージコイン価格

The price is currently trading above both the 50 and 20-Day EMAs, indicating strong selling pressure.
The Moving Average Convergence Divergence (MACD) line (blue) also supports the mild bullishness trend as it trades just above the signal line (orange). The histogram is in the positive, showing green bars slightly extending on the price.
価格は現在、50日EMAと20日EMAの両方を上回って取引されており、強い売り圧力を示しています。移動平均収束ダイバージェンス(MACD)ライン(青)もシグナルライン(オレンジ)のすぐ上で取引されており、穏やかな強気トレンドを裏付けています。ヒストグラムはプラスで、緑色のバーが価格上でわずかに伸びていることが示されています。
However, the Relative Strength Index (RSI) is recovering from below the 30-oversold region, sitting at 51.01 and moving upward. A sustained push should make the RSI cross the 50 midline level.
しかし、相対力指数(RSI)は売られ過ぎ30の領域を下回って回復しつつあり、51.01で推移しており、上昇傾向にあります。押し続ければ、RSIは50の正中線レベルを超えるはずです。
Summary
まとめ
The DOGE price analysis highlights mild bullishness in the crypto price on the daily technical chart. EMAs are supporting the price on the daily technical time frame chart. Moreover, crypto is currently facing selling pressure as it struggles to sustain its present level. Moreover, volume is up, but not enough to generate buying momentum. However, Dogecoin needs to attract more buyers to surge from the current level and start the recovery phase.
DOGEの価格分析は、日次テクニカルチャートの仮想通貨価格の穏やかな強気性を浮き彫りにしています。 EMAは日次テクニカルタイムフレームチャートの価格をサポートしています。さらに、仮想通貨は現在、現在の水準を維持するのに苦労しているため、売り圧力に直面している。さらに、出来高は増加していますが、購入の勢いを生み出すには十分ではありません。しかし、ドージコインが現在のレベルから急騰し、回復段階を開始するには、より多くの買い手を引き付ける必要があります。
Technical Levels
技術レベル
Support Level: $0.0781
サポートレベル: $0.0781
Resistance Level: $0.0907
抵抗レベル: $0.0907
Disclaimer
免責事項
This article is for informational purposes only and provides no financial, investment, or other advice. The author or any people mentioned in this article are not responsible for any financial loss that may occur from investing in or trading. Please do your research before making any financial decisions.
この記事は情報提供のみを目的としており、財務、投資、その他のアドバイスは提供しません。著者またはこの記事で言及されている人物は、投資または取引によって発生する可能性のある経済的損失に対して責任を負いません。財務上の決定を下す前に、調査を行ってください。


 ItsBitcoinWorld
 Cryptopolitan_News
 U_Today
 Cryptopolitan_News
 DT News
 Cryptopolitan_News
 Thecryptoupdates
 DogeHome
 Coincu


