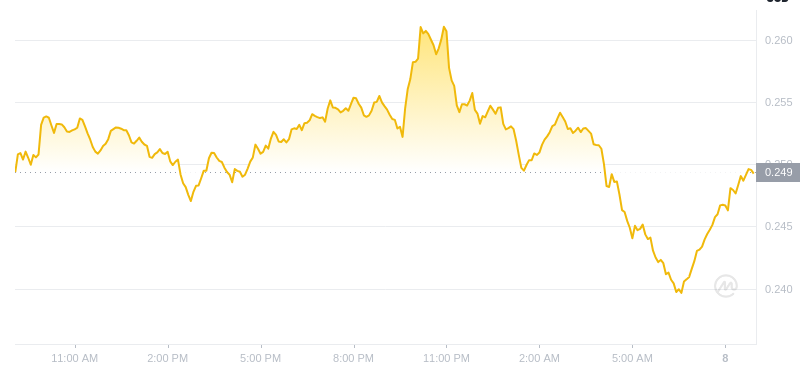
Dogecoin Price Pumps 19%, Hints at Sustained Uptrend
Over the past week, Dogecoin's value has surged by 19%, climbing 0.5% over the last 24 hours. As of 3:30 AM EST, it trades at $0.3818, despite a 16% decline in trading volume to $3 billion.
Technical Analysis Suggests Continued Price Gains
The DOGE/USDT trading pair on the 1-day chart exhibits a combination of patterns and indicators that hint at both historical price behavior and potential future gains. From May to July 2024, Dogecoin remained within a bearish channel, signaling a prolonged downtrend.
However, a breakout in late July initiated a trend reversal. Subsequently, a bullish cup and handle pattern emerged between August and October. This pattern, characterized by a rounded bottom (the "cup") and a slight retracement (the "handle"), culminated in a breakout in October, pushing prices upward.
Key Support and Resistance Levels
Presently, Dogecoin hovers near a crucial support zone between $0.30 and $0.35. This zone has served as a significant foundation for potential price increases since December 2024. The 50-day moving average (MA50) aligns with the current price at $0.38137, providing immediate support. In contrast, the 200-day moving average (MA200) at $0.19447 lies below, indicating a broader bullish trend in the long term.
Momentum and Oscillators
The Relative Strength Index (RSI) stands at 57.99, slightly above the neutral zone. This suggests a modest bullish momentum. The RSI has rebounded from the midline (50), indicating potential building buying pressure.
Potential Price Targets and Risks
The current DOGE/USDT structure implies the possibility of continued price appreciation. The support zone of $0.30–$0.35 is integral to maintaining upward momentum. A breakout above $0.40 could clear the path for a rise towards the $0.50–$0.55 resistance zone.
Conversely, failure to sustain the support zone may lead to a retest of $0.28 or even the MA200 level at $0.19.


 CFN
CFN TheCoinrise Media
 DogeHome
 CFN
CFN TheNewsCrypto
 Crypto Daily™
 Times Tabloid
 BH NEWS
 COINTURK NEWS


