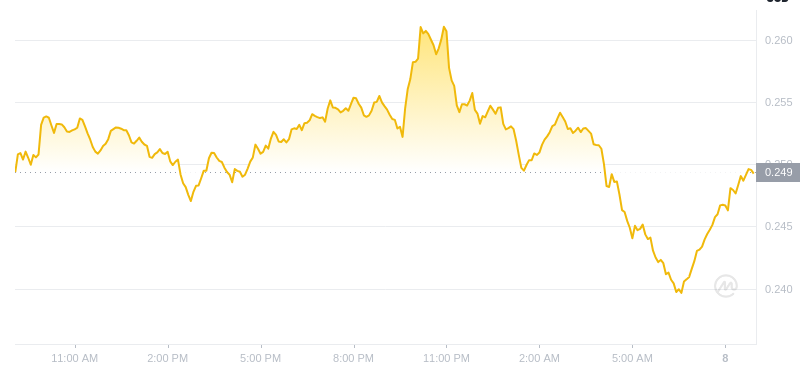
Dogecoin Price Pumps 19%, Hints at Sustained Uptrend
Dogecoin 가격 19% 상승, 지속적인 상승 추세에 대한 힌트
Over the past week, Dogecoin's value has surged by 19%, climbing 0.5% over the last 24 hours. As of 3:30 AM EST, it trades at $0.3818, despite a 16% decline in trading volume to $3 billion.
지난 주 동안 Dogecoin의 가치는 19% 급등하여 지난 24시간 동안 0.5% 상승했습니다. 오전 3시 30분(EST) 현재 거래량이 30억 달러로 16% 감소했음에도 불구하고 0.3818달러에 거래되고 있습니다.
Technical Analysis Suggests Continued Price Gains
기술적 분석은 지속적인 가격 상승을 제안합니다
The DOGE/USDT trading pair on the 1-day chart exhibits a combination of patterns and indicators that hint at both historical price behavior and potential future gains. From May to July 2024, Dogecoin remained within a bearish channel, signaling a prolonged downtrend.
1일 차트의 DOGE/USDT 거래 쌍은 과거 가격 동향과 잠재적 미래 이익을 모두 암시하는 패턴과 지표의 조합을 보여줍니다. 2024년 5월부터 7월까지 Dogecoin은 약세 채널 내에 머물면서 장기적인 하락세를 예고했습니다.
However, a breakout in late July initiated a trend reversal. Subsequently, a bullish cup and handle pattern emerged between August and October. This pattern, characterized by a rounded bottom (the "cup") and a slight retracement (the "handle"), culminated in a breakout in October, pushing prices upward.
그러나 7월 말의 돌파로 인해 추세 반전이 시작되었습니다. 이후 8월과 10월 사이에 상승세를 보이는 컵 앤 핸들 패턴이 나타났습니다. 둥근 바닥("컵")과 약간의 되돌림("손잡이")이 특징인 이 패턴은 10월 돌파로 최고조에 달해 가격을 상승시켰습니다.
Key Support and Resistance Levels
주요 지지 및 저항 수준
Presently, Dogecoin hovers near a crucial support zone between $0.30 and $0.35. This zone has served as a significant foundation for potential price increases since December 2024. The 50-day moving average (MA50) aligns with the current price at $0.38137, providing immediate support. In contrast, the 200-day moving average (MA200) at $0.19447 lies below, indicating a broader bullish trend in the long term.
현재 Dogecoin은 $0.30에서 $0.35 사이의 중요한 지지 영역 근처에 맴돌고 있습니다. 이 영역은 2024년 12월 이후 잠재적 가격 인상의 중요한 기반 역할을 했습니다. 50일 이동 평균(MA50)은 현재 가격 $0.38137와 일치하여 즉각적인 지원을 제공합니다. 이와 대조적으로 200일 이동 평균(MA200)은 0.19447달러로 아래에 있어 장기적으로 더 넓은 강세 추세를 나타냅니다.
Momentum and Oscillators
모멘텀과 오실레이터
The Relative Strength Index (RSI) stands at 57.99, slightly above the neutral zone. This suggests a modest bullish momentum. The RSI has rebounded from the midline (50), indicating potential building buying pressure.
상대강도지수(RSI)는 57.99로 중립지대보다 약간 높습니다. 이는 완만한 강세 모멘텀을 시사합니다. RSI가 미드라인(50)에서 반등해 잠재적인 매수 압력을 나타냈습니다.
Potential Price Targets and Risks
잠재적 가격 목표 및 위험
The current DOGE/USDT structure implies the possibility of continued price appreciation. The support zone of $0.30–$0.35 is integral to maintaining upward momentum. A breakout above $0.40 could clear the path for a rise towards the $0.50–$0.55 resistance zone.
현재 DOGE/USDT 구조는 지속적인 가격 상승 가능성을 암시합니다. $0.30~$0.35의 지지 구역은 상승 모멘텀을 유지하는 데 필수적입니다. $0.40를 돌파하면 $0.50~$0.55 저항대를 향한 상승 경로가 확보될 수 있습니다.
Conversely, failure to sustain the support zone may lead to a retest of $0.28 or even the MA200 level at $0.19.
반대로, 지원 영역을 유지하지 못하면 $0.28의 재테스트 또는 심지어 $0.19의 MA200 수준으로 이어질 수 있습니다.


 Optimisus
 Optimisus
 CFN
CFN TheCoinrise Media
 DogeHome
 CFN
CFN TheNewsCrypto
 Crypto Daily™
 Times Tabloid


