Pepe and Bonk Prices Surge Over 30% Amid $400 Million Liquidation: What to Expect Next
The memecoin market is experiencing a surge in activity, with Solana-based meme coins witnessing substantial price gains. The anticipation of a potential spot Ethereum ETF approval by the SEC has fueled buying demand in the crypto market, driving up meme coin prices. Pepe and Bonk have witnessed a remarkable surge of over 30% in just 24 hours. However, analysts anticipate mixed signals in the coming hours.
Market Liquidation Nears $400 Million
The crypto market has experienced significant buying pressure in the past 24 hours. Bitcoin (BTC) has surpassed the $70,000 mark, while Ethereum (ETH) approaches the $4,000 milestone. Data from Coinglass reveals that total market liquidations have exceeded $390 million.
Solana Meme Coins Rise
Solana (SOL) meme coins have emerged as notable gainers. Pepe has reached a new all-time high, while Bonk leads the rally with a robust 30% increase.
Pepe Price Analysis
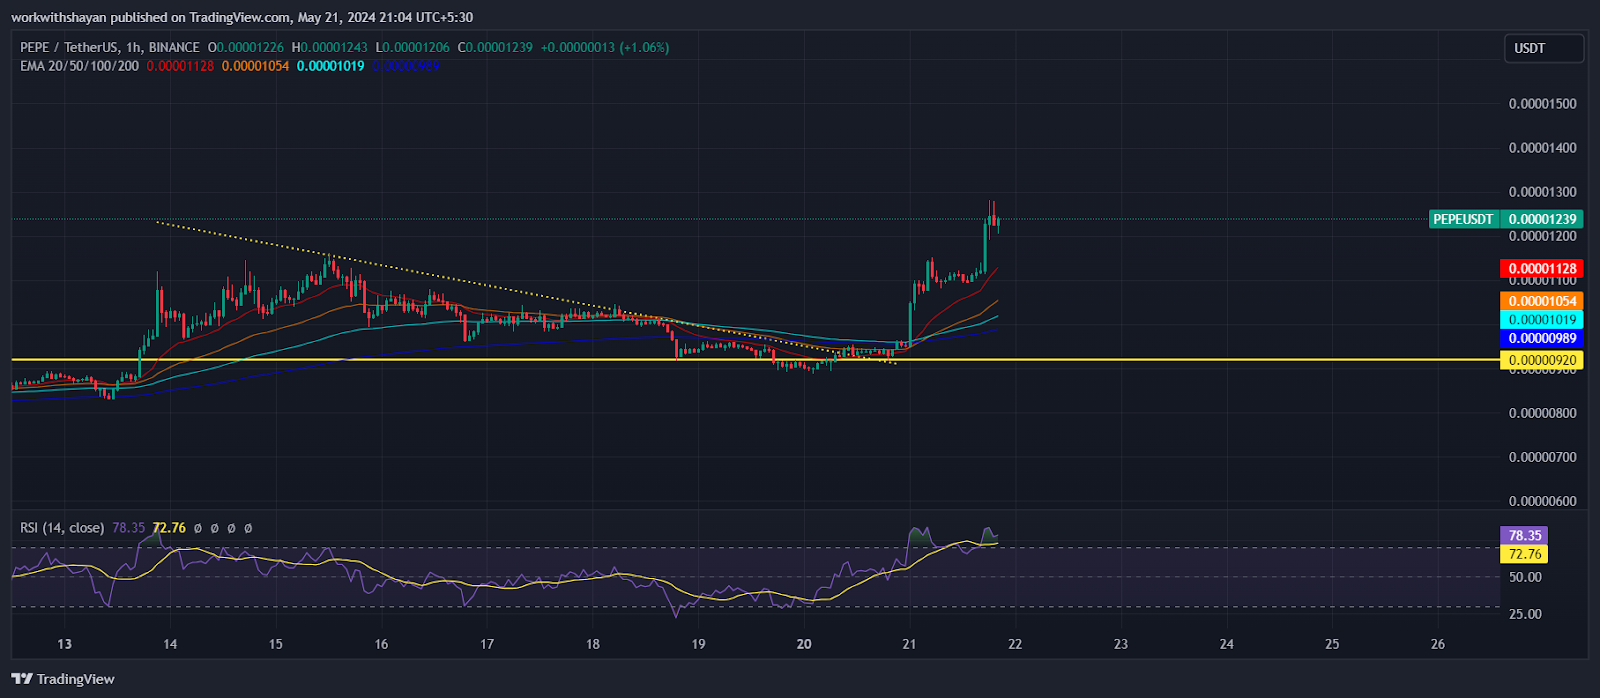
Pepe is currently facing bearish pressure following a selloff from its recent high of $0.00001281. The price attempts to fall below the EMA20 trend line, but buyers are actively defending the decline. At present, Pepe trades at $0.00001212, marking a surge of over 30% in the past 24 hours.

Buyers aim to keep the price above the 20-day EMA ($0.00001034). Success in this endeavor could lead to a recovery towards the high of $0.0000128. This level is critical for bears to defend, as a breakout could trigger a further rise towards the overhead resistance zone between $0.000015 and $0.000017.
Conversely, a break and close below the $0.00001-$0.000008 support zone would confirm a bearish pattern. The pair could then decline towards the strong support at $0.0000055. The RSI indicator is trending upwards towards the overbought region, suggesting a potential correction.
Bonk Price Analysis
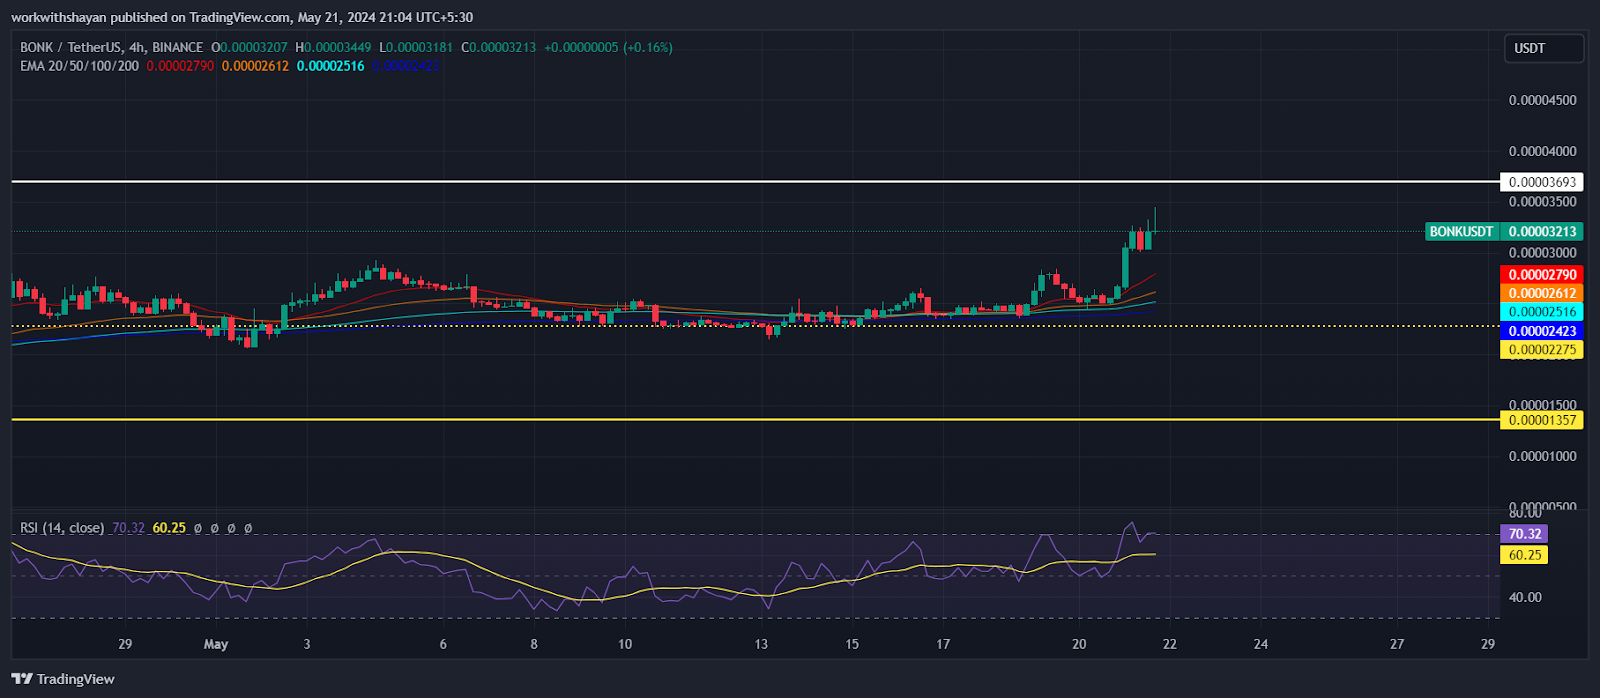
Bonk price has exhibited an uptrend, with bulls propelling it above the overhead resistance of $0.000029. Bonk currently trades at $0.0000323, reflecting a surge of over 27% in the past 24 hours.

The bulls are targeting a move towards $0.00003693, and a successful breakout could pave the way for a rise to $0.000047. However, bears may offer stiff resistance at these levels.
The EMA20 trend line is a key level to monitor. A strong rebound from this level would indicate buying on dips, increasing the likelihood of breaking the psychological resistance at $0.000037. On the other hand, a sharp decline below the 20-day EMA would suggest that bulls are exiting, potentially triggering a correction to the 50-day SMA at $0.00002275.
The RSI indicator on the 4-hour price chart is rising and currently trades around 70, which could indicate a bearish correction.


 U_Today
 Thecoinrepublic.com
 DogeHome
 Optimisus
 Optimisus
 DeFi Planet
 Crypto Daily™
 BlockchainReporter
 TheCoinrise Media


