Pepe and Bonk Prices Surge Over 30% Amid $400 Million Liquidation: What to Expect Next
4억 달러 청산 중에 Pepe 및 Bonk 가격이 30% 이상 급등: 다음에 기대할 사항
The memecoin market is experiencing a surge in activity, with Solana-based meme coins witnessing substantial price gains. The anticipation of a potential spot Ethereum ETF approval by the SEC has fueled buying demand in the crypto market, driving up meme coin prices. Pepe and Bonk have witnessed a remarkable surge of over 30% in just 24 hours. However, analysts anticipate mixed signals in the coming hours.
밈코인 시장은 솔라나 기반 밈 코인의 상당한 가격 상승을 목격하면서 활발한 활동을 경험하고 있습니다. SEC의 잠재적 현물 이더리움 ETF 승인에 대한 기대는 암호화폐 시장의 구매 수요를 촉진하여 밈 코인 가격을 상승시켰습니다. Pepe와 Bonk는 단 24시간 만에 30%가 넘는 놀라운 상승세를 보였습니다. 그러나 분석가들은 앞으로 몇 시간 내에 엇갈린 신호가 나타날 것으로 예상합니다.
Market Liquidation Nears $400 Million
시장 청산액이 4억 달러에 가까워졌습니다.
The crypto market has experienced significant buying pressure in the past 24 hours. Bitcoin (BTC) has surpassed the $70,000 mark, while Ethereum (ETH) approaches the $4,000 milestone. Data from Coinglass reveals that total market liquidations have exceeded $390 million.
암호화폐 시장은 지난 24시간 동안 상당한 매수 압력을 경험했습니다. 비트코인(BTC)은 70,000달러를 넘어섰고, 이더리움(ETH)은 4,000달러를 돌파했습니다. Coinglass의 데이터에 따르면 총 시장 청산액은 3억 9천만 달러를 초과했습니다.
Solana Meme Coins Rise
Solana Meme 코인 상승
Solana (SOL) meme coins have emerged as notable gainers. Pepe has reached a new all-time high, while Bonk leads the rally with a robust 30% increase.
솔라나(SOL) 밈 코인이 주목할만한 상승세로 나타났습니다. Pepe는 새로운 사상 최고치를 경신했으며 Bonk는 30%의 강력한 증가세로 랠리를 주도하고 있습니다.
Pepe Price Analysis
페페 가격 분석
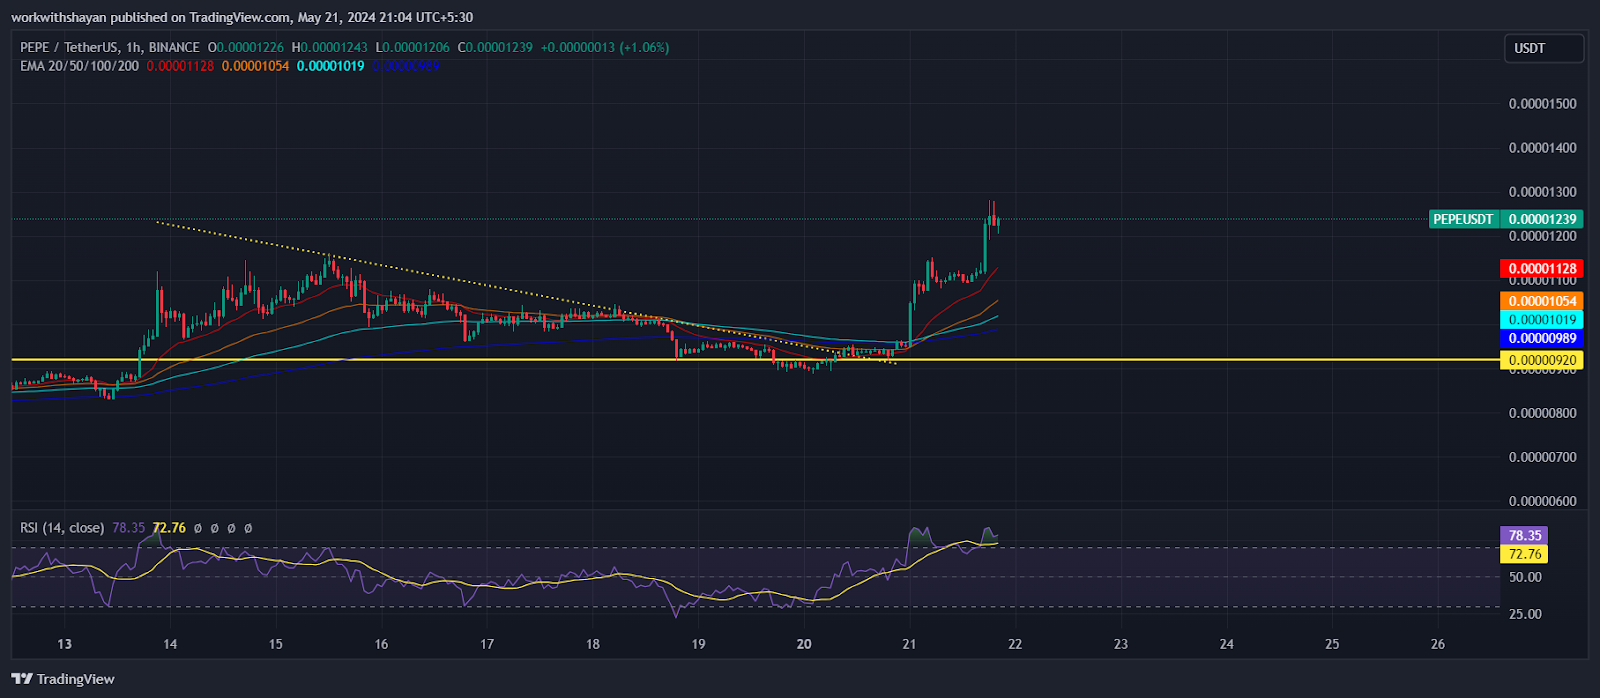
Pepe is currently facing bearish pressure following a selloff from its recent high of $0.00001281. The price attempts to fall below the EMA20 trend line, but buyers are actively defending the decline. At present, Pepe trades at $0.00001212, marking a surge of over 30% in the past 24 hours.
Pepe는 최근 최고치인 $0.00001281에서 매도세를 보인 후 약세 압력에 직면해 있습니다. 가격은 EMA20 추세선 아래로 떨어지려고 시도하지만 구매자들은 하락을 적극적으로 방어하고 있습니다. 현재 Pepe는 $0.00001212에 거래되어 지난 24시간 동안 30% 이상 급등했습니다.

Buyers aim to keep the price above the 20-day EMA ($0.00001034). Success in this endeavor could lead to a recovery towards the high of $0.0000128. This level is critical for bears to defend, as a breakout could trigger a further rise towards the overhead resistance zone between $0.000015 and $0.000017.
구매자는 가격을 20일 EMA($0.00001034) 이상으로 유지하는 것을 목표로 합니다. 이 노력이 성공하면 $0.0000128의 최고치를 향해 회복될 수 있습니다. 이 수준은 곰이 방어하는 데 매우 중요합니다. 돌파가 발생하면 $0.000015에서 $0.000017 사이의 머리 위 저항 영역을 향한 추가 상승을 유발할 수 있기 때문입니다.
Conversely, a break and close below the $0.00001-$0.000008 support zone would confirm a bearish pattern. The pair could then decline towards the strong support at $0.0000055. The RSI indicator is trending upwards towards the overbought region, suggesting a potential correction.
반대로, $0.00001-$0.000008 지지대 아래에서 종가가 형성된다면 약세 패턴이 확인될 것입니다. 그러면 해당 쌍은 $0.0000055의 강력한 지지를 향해 하락할 수 있습니다. RSI 지표는 과매수 영역을 향해 상승 추세를 보이고 있어 조정 가능성을 시사하고 있습니다.
Bonk Price Analysis
봉크 가격 분석
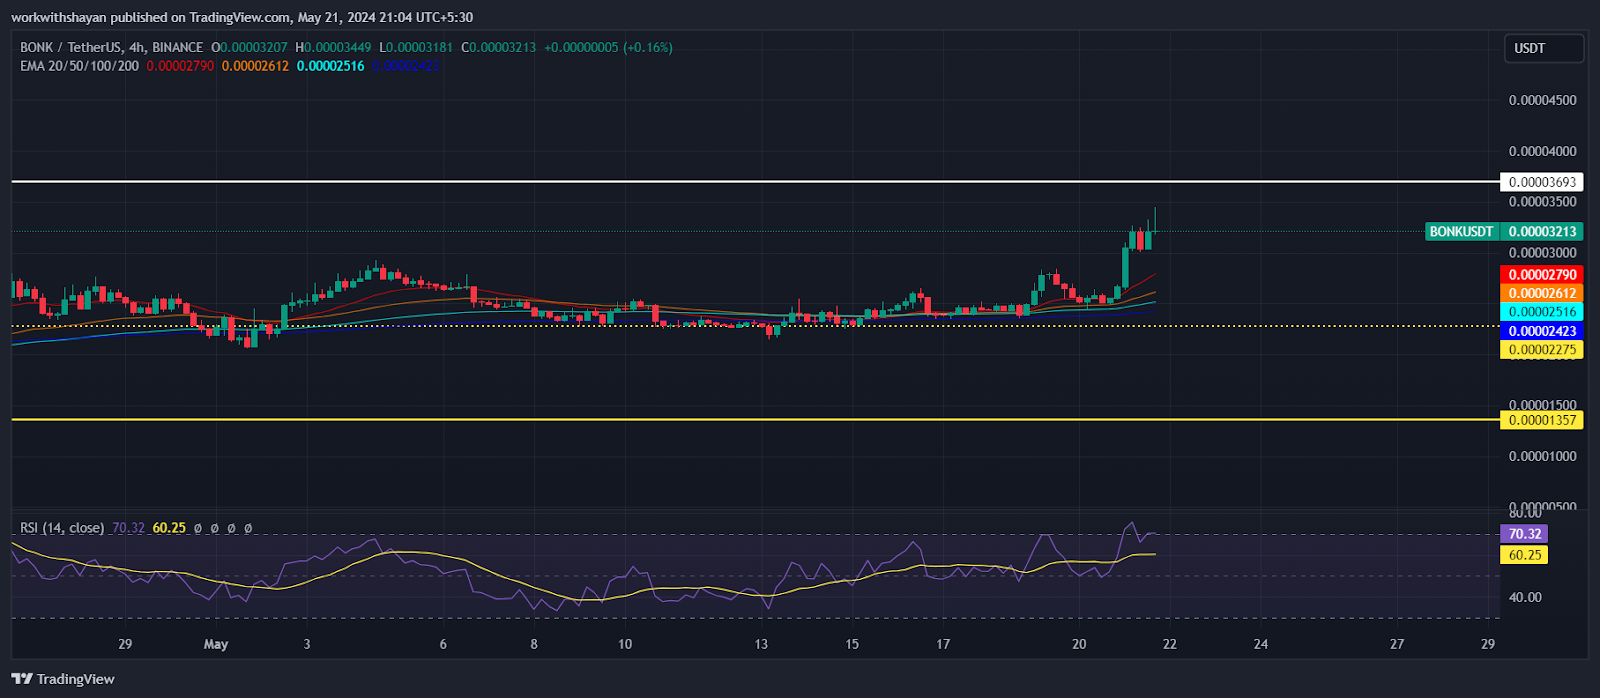
Bonk price has exhibited an uptrend, with bulls propelling it above the overhead resistance of $0.000029. Bonk currently trades at $0.0000323, reflecting a surge of over 27% in the past 24 hours.
Bonk 가격은 상승세를 보였으며 상승세가 $0.000029의 저항선 위로 상승했습니다. Bonk는 현재 $0.0000323에 거래되고 있으며 이는 지난 24시간 동안 27% 이상의 급등을 반영합니다.

The bulls are targeting a move towards $0.00003693, and a successful breakout could pave the way for a rise to $0.000047. However, bears may offer stiff resistance at these levels.
황소는 $0.00003693을 향한 움직임을 목표로 하고 있으며 성공적인 돌파는 $0.000047까지 상승할 수 있는 길을 열어줄 수 있습니다. 그러나 곰은 이러한 수준에서 강력한 저항을 제공할 수 있습니다.
The EMA20 trend line is a key level to monitor. A strong rebound from this level would indicate buying on dips, increasing the likelihood of breaking the psychological resistance at $0.000037. On the other hand, a sharp decline below the 20-day EMA would suggest that bulls are exiting, potentially triggering a correction to the 50-day SMA at $0.00002275.
EMA20 추세선은 모니터링해야 할 핵심 수준입니다. 이 수준에서 강한 반등이 일어난다면 하락 시 매수를 의미하며 $0.000037에서 심리적 저항선을 깨뜨릴 가능성이 높아집니다. 반면에 20일 EMA 아래로 급격한 하락은 상승세가 종료되고 있음을 의미하며 잠재적으로 $0.00002275에서 50일 SMA에 대한 조정을 촉발할 수 있습니다.
The RSI indicator on the 4-hour price chart is rising and currently trades around 70, which could indicate a bearish correction.
4시간 가격 차트의 RSI 지표는 상승하고 있으며 현재 약세 조정을 나타낼 수 있는 70 근처에 거래되고 있습니다.


 crypto.ro English
 DogeHome
 Crypto News Land
 ETHNews
 CFN
CFN U_Today
 Thecoinrepublic.com
 Optimisus


