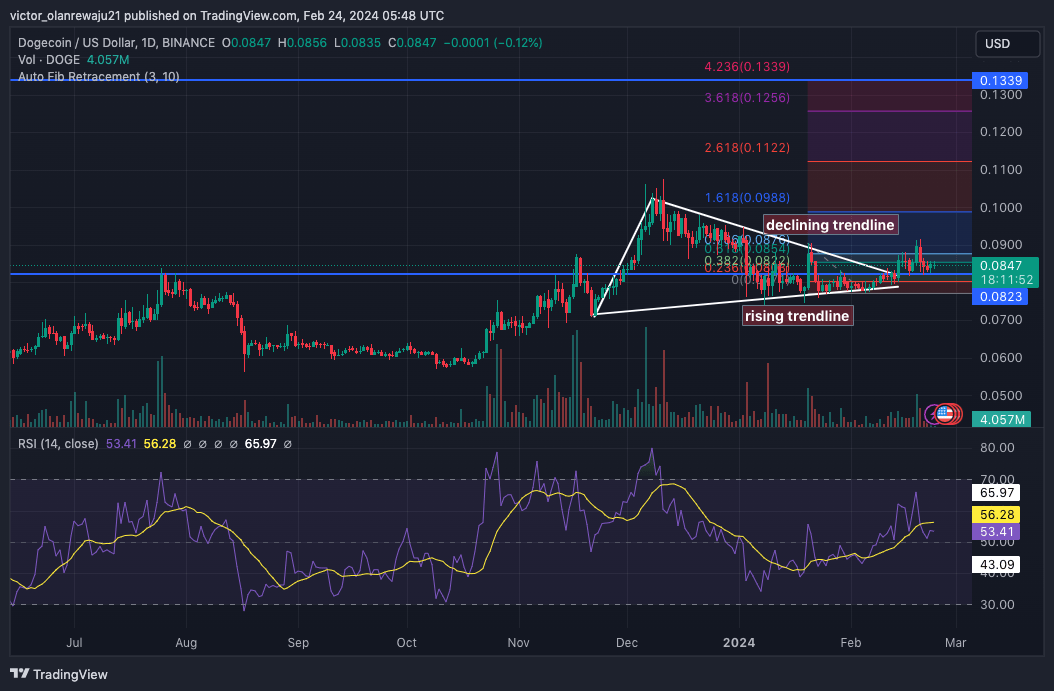
Dogecoin (DOGE) on the daily chart has formed an asymmetrical triangle, where buyers are working to keep the price above $0.090, but sellers are pushing it down despite their efforts.
Cryptos Headlines Token Airdrop Is Live, Claim Instant 5000 CHT Tokens Worth Of $50 Free On CryptosHeadlinesToken.com

The asymmetrical triangle formation hints at a possible breakout for DOGE. However, before any potential rally, the price of the cryptocurrency might drop. Currently, DOGE is priced at $0.084.
Analyzing DOGE Price Movement
Indicators from the Relative Strength Index (RSI) are hinting at a decline in bullish control over DOGE’s price. If the RSI reading falls below 50.00, there’s a possibility that DOGE could drop to $0.080. However, bullish investors are likely to attempt to push the price higher.
For instance, in case sellers manage to pull down the price, DOGE might decline to $0.0823, aligning with the 0.236 Fibonacci retracement level. If the price bounces back from this point, DOGE could initiate an upward trend towards $0.133, corresponding to the 4.236 Fibonacci retracement level.
Conversely, the bullish outlook may be invalidated if the price falls below $0.080. Such a scenario would indicate increasing bearish dominance amidst heightened selling pressure. In this case, DOGE could descend towards $0.071, potentially hindering any significant relief rally.

DOGE/USD Daily Chart (Source: TradingView)
Cryptos Headlines Token Airdrop Is Live, Claim Instant 5000 CHT Tokens Worth Of $50 Free On CryptosHeadlinesToken.com

Analyst Predicts Massive Breakout for DOGE: Potential Surge to $10
According to analyst Ali Martinez, a recent post on X suggests that Dogecoin (DOGE) may experience a significant breakout beyond the anticipated rise to $0.133. Martinez pointed out a pattern on the weekly chart reminiscent of one observed in 2020.
Also Read: Japan Explores VC Investment in Crypto and Web3 Startups
During that period, Dogecoin’s price surged by a staggering 28,770%. Martinez’s analysis indicates that a potential breakout from the descending triangle pattern could catalyze another bull run for DOGE. Based on the chart shared by Martinez, he suggests that DOGE could potentially approach the $10 mark at some point.
The price action of #Dogecoin is showing familiar patterns reminiscent of its 2020 behavior. Back then, $DOGE broke out from a descending triangle, entered a period of consolidation, and then skyrocketed by 28,770%.Currently, #DOGE appears to be mirroring this pattern: having… pic.twitter.com/69yXnlYRJd— Ali (@ali_charts) February 23, 2024
Technical Indicators Hint at DOGE’s Potential Upside
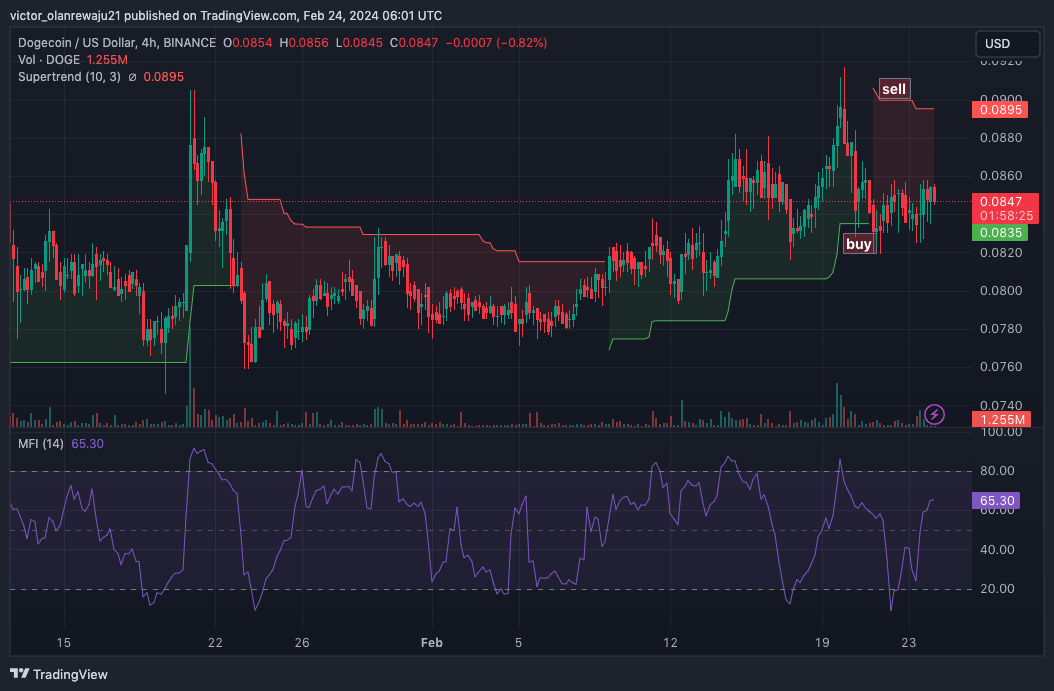
On the 4-hour DOGE/USD chart, the Supertrend indicator revealed a sell signal near $0.089, explaining the struggle for the coin to surpass $0.090. However, the same indicator indicated a buy signal at $0.083.
Traders who purchase DOGE around this level might find profitability if the price rebounds from the lows. Additionally, the Money Flow Index (MFI) surged to $65.30, indicating a notable increase in capital inflow.

DOGE/USD 4-Hour Chart (Source: TradingView)
This uptick serves as evidence of mounting buying pressure. With continued upward pressure, DOGE’s price may be primed for a significant rally. If the price manages to breach $0.090, DOGE could potentially target $0.13 in the short term.
Important: Please note that this article is only meant to provide information and should not be taken as legal, tax, investment, financial, or any other type of advice.


 Crypto Daily™
 BlockchainReporter
 Optimisus
 DogeHome
 Crypto News Land
 Optimisus
 Crypto News Land
 Crypto News Land


