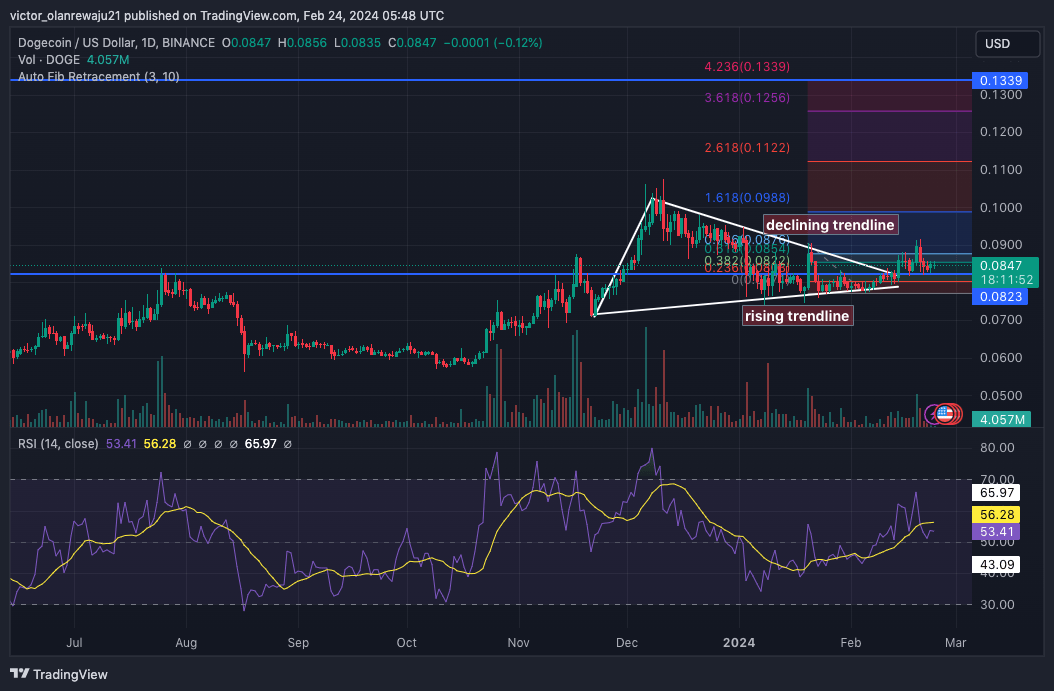
Dogecoin (DOGE) on the daily chart has formed an asymmetrical triangle, where buyers are working to keep the price above $0.090, but sellers are pushing it down despite their efforts.
日线图上的狗狗币 (DOGE) 已形成一个不对称三角形,买家正在努力将价格保持在 0.090 美元以上,但卖家尽管做出了努力,但仍将价格压低。
Cryptos Headlines Token Airdrop Is Live, Claim Instant 5000 CHT Tokens Worth Of $50 Free On CryptosHeadlinesToken.com

Cryptos Headlines 代币空投已上线,在 CryptosHeadlinesToken.com 上免费领取价值 50 美元的即时 5000 个 CHT 代币
The asymmetrical triangle formation hints at a possible breakout for DOGE. However, before any potential rally, the price of the cryptocurrency might drop. Currently, DOGE is priced at $0.084.
不对称三角形形态暗示 DOGE 可能出现突破。然而,在任何潜在的反弹之前,加密货币的价格可能会下跌。目前,DOGE 的价格为 0.084 美元。
Analyzing DOGE Price Movement
Indicators from the Relative Strength Index (RSI) are hinting at a decline in bullish control over DOGE’s price. If the RSI reading falls below 50.00, there’s a possibility that DOGE could drop to $0.080. However, bullish investors are likely to attempt to push the price higher.
分析 DOGE 价格走势 相对强度指数 (RSI) 的指标暗示对 DOGE 价格的看涨控制力下降。如果 RSI 读数跌破 50.00,DOGE 可能会跌至 0.080 美元。然而,看涨的投资者可能会试图推高价格。
For instance, in case sellers manage to pull down the price, DOGE might decline to $0.0823, aligning with the 0.236 Fibonacci retracement level. If the price bounces back from this point, DOGE could initiate an upward trend towards $0.133, corresponding to the 4.236 Fibonacci retracement level.
例如,如果卖家设法拉低价格,DOGE 可能会跌至 0.0823 美元,与 0.236 斐波那契回撤位保持一致。如果价格从该点反弹,DOGE 可能会开始上涨至 0.133 美元,对应于 4.236 斐波那契回撤位。
Conversely, the bullish outlook may be invalidated if the price falls below $0.080. Such a scenario would indicate increasing bearish dominance amidst heightened selling pressure. In this case, DOGE could descend towards $0.071, potentially hindering any significant relief rally.
相反,如果价格跌破 0.080 美元,看涨前景可能会失效。这种情况将表明,在抛售压力加大的情况下,看跌主导地位正在增强。在这种情况下,DOGE 可能会跌至 0.071 美元,可能会阻碍任何重大的缓解反弹。

DOGE/USD Daily Chart (Source: TradingView)
DOGE/USD 日线图(来源:TradingView)
Cryptos Headlines Token Airdrop Is Live, Claim Instant 5000 CHT Tokens Worth Of $50 Free On CryptosHeadlinesToken.com

Cryptos Headlines 代币空投已上线,在 CryptosHeadlinesToken.com 上免费领取价值 50 美元的即时 5000 个 CHT 代币
Analyst Predicts Massive Breakout for DOGE: Potential Surge to $10
According to analyst Ali Martinez, a recent post on X suggests that Dogecoin (DOGE) may experience a significant breakout beyond the anticipated rise to $0.133. Martinez pointed out a pattern on the weekly chart reminiscent of one observed in 2020.
分析师预测 DOGE 将大幅突破:可能飙升至 10 美元 根据分析师 Ali Martinez 的说法,X 最近的一篇文章表明,狗狗币 (DOGE) 可能会经历一次重大突破,超出预期的上涨至 0.133 美元。马丁内斯指出,周线图上的一种模式让人想起 2020 年观察到的模式。
Also Read: Japan Explores VC Investment in Crypto and Web3 Startups
另请阅读:日本探索对加密货币和 Web3 初创公司的风险投资
During that period, Dogecoin’s price surged by a staggering 28,770%. Martinez’s analysis indicates that a potential breakout from the descending triangle pattern could catalyze another bull run for DOGE. Based on the chart shared by Martinez, he suggests that DOGE could potentially approach the $10 mark at some point.
在此期间,狗狗币的价格飙升了惊人的 28,770%。马丁内斯的分析表明,下降三角形格局的潜在突破可能会催化狗狗币的另一场牛市。根据 Martinez 分享的图表,他认为 DOGE 可能会在某个时候接近 10 美元大关。
The price action of #Dogecoin is showing familiar patterns reminiscent of its 2020 behavior. Back then, $DOGE broke out from a descending triangle, entered a period of consolidation, and then skyrocketed by 28,770%.Currently, #DOGE appears to be mirroring this pattern: having… pic.twitter.com/69yXnlYRJd— Ali (@ali_charts) February 23, 2024
Technical Indicators Hint at DOGE’s Potential Upside
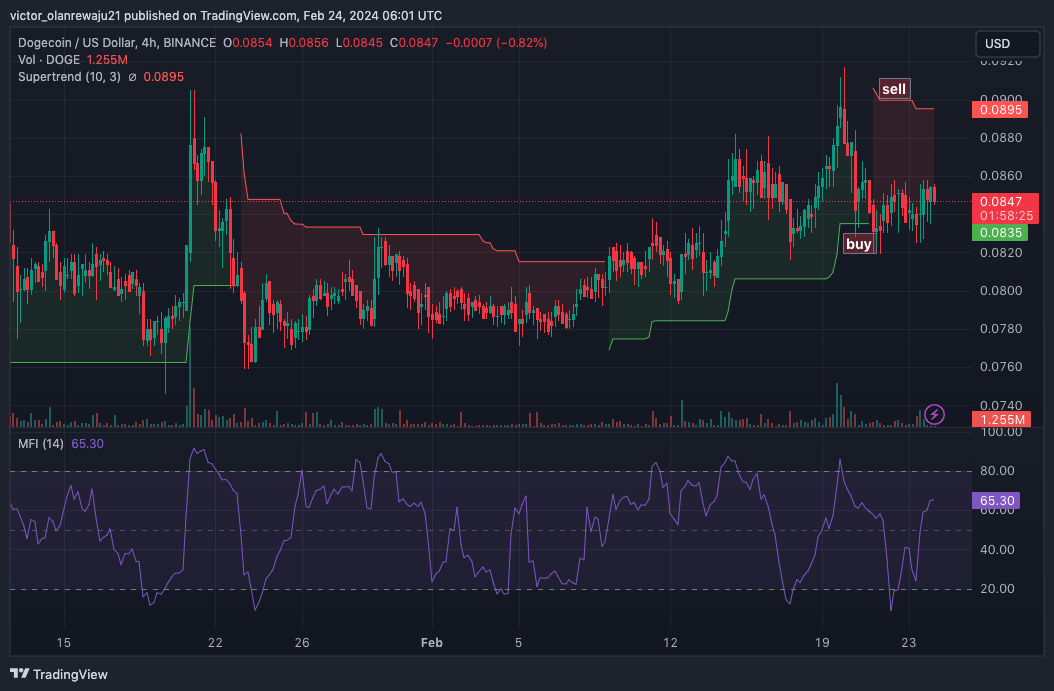
On the 4-hour DOGE/USD chart, the Supertrend indicator revealed a sell signal near $0.089, explaining the struggle for the coin to surpass $0.090. However, the same indicator indicated a buy signal at $0.083.
#Dogecoin 的价格走势显示出熟悉的模式,让人想起其 2020 年的行为。当时,$DOGE 从下降三角形中突破,进入盘整期,然后飙升了 28,770%。目前,#DOGE 似乎反映了这种模式:有… pic.twitter.com/69yXnlYRJd — Ali (@ali_charts ) 2024 年 2 月 23 日技术指标暗示 DOGE 的潜在上涨空间在 4 小时 DOGE/USD 图表上,超级趋势指标显示接近 0.089 美元的卖出信号,解释了该货币为何难以突破 0.090 美元。然而,同一指标在 0.083 美元处显示买入信号。
Traders who purchase DOGE around this level might find profitability if the price rebounds from the lows. Additionally, the Money Flow Index (MFI) surged to $65.30, indicating a notable increase in capital inflow.
如果价格从低点反弹,在此水平附近购买 DOGE 的交易者可能会获利。此外,资金流量指数(MFI)飙升至65.30美元,表明资本流入显着增加。

DOGE/USD 4-Hour Chart (Source: TradingView)
DOGE/USD 4 小时图表(来源:TradingView)
This uptick serves as evidence of mounting buying pressure. With continued upward pressure, DOGE’s price may be primed for a significant rally. If the price manages to breach $0.090, DOGE could potentially target $0.13 in the short term.
这种上涨证明了购买压力不断加大。随着持续的上涨压力,DOGE 的价格可能会出现大幅上涨。如果价格突破 0.090 美元,DOGE 短期内的目标可能是 0.13 美元。
Important: Please note that this article is only meant to provide information and should not be taken as legal, tax, investment, financial, or any other type of advice.
重要提示:请注意,本文仅旨在提供信息,不应被视为法律、税务、投资、财务或任何其他类型的建议。


 TheCoinrise Media
 DogeHome
 Crypto Daily™
 Crypto Daily™
 TheCoinrise Media
 Thecoinrepublic.com
 TheCoinrise Media
 TheCoinrise Media


