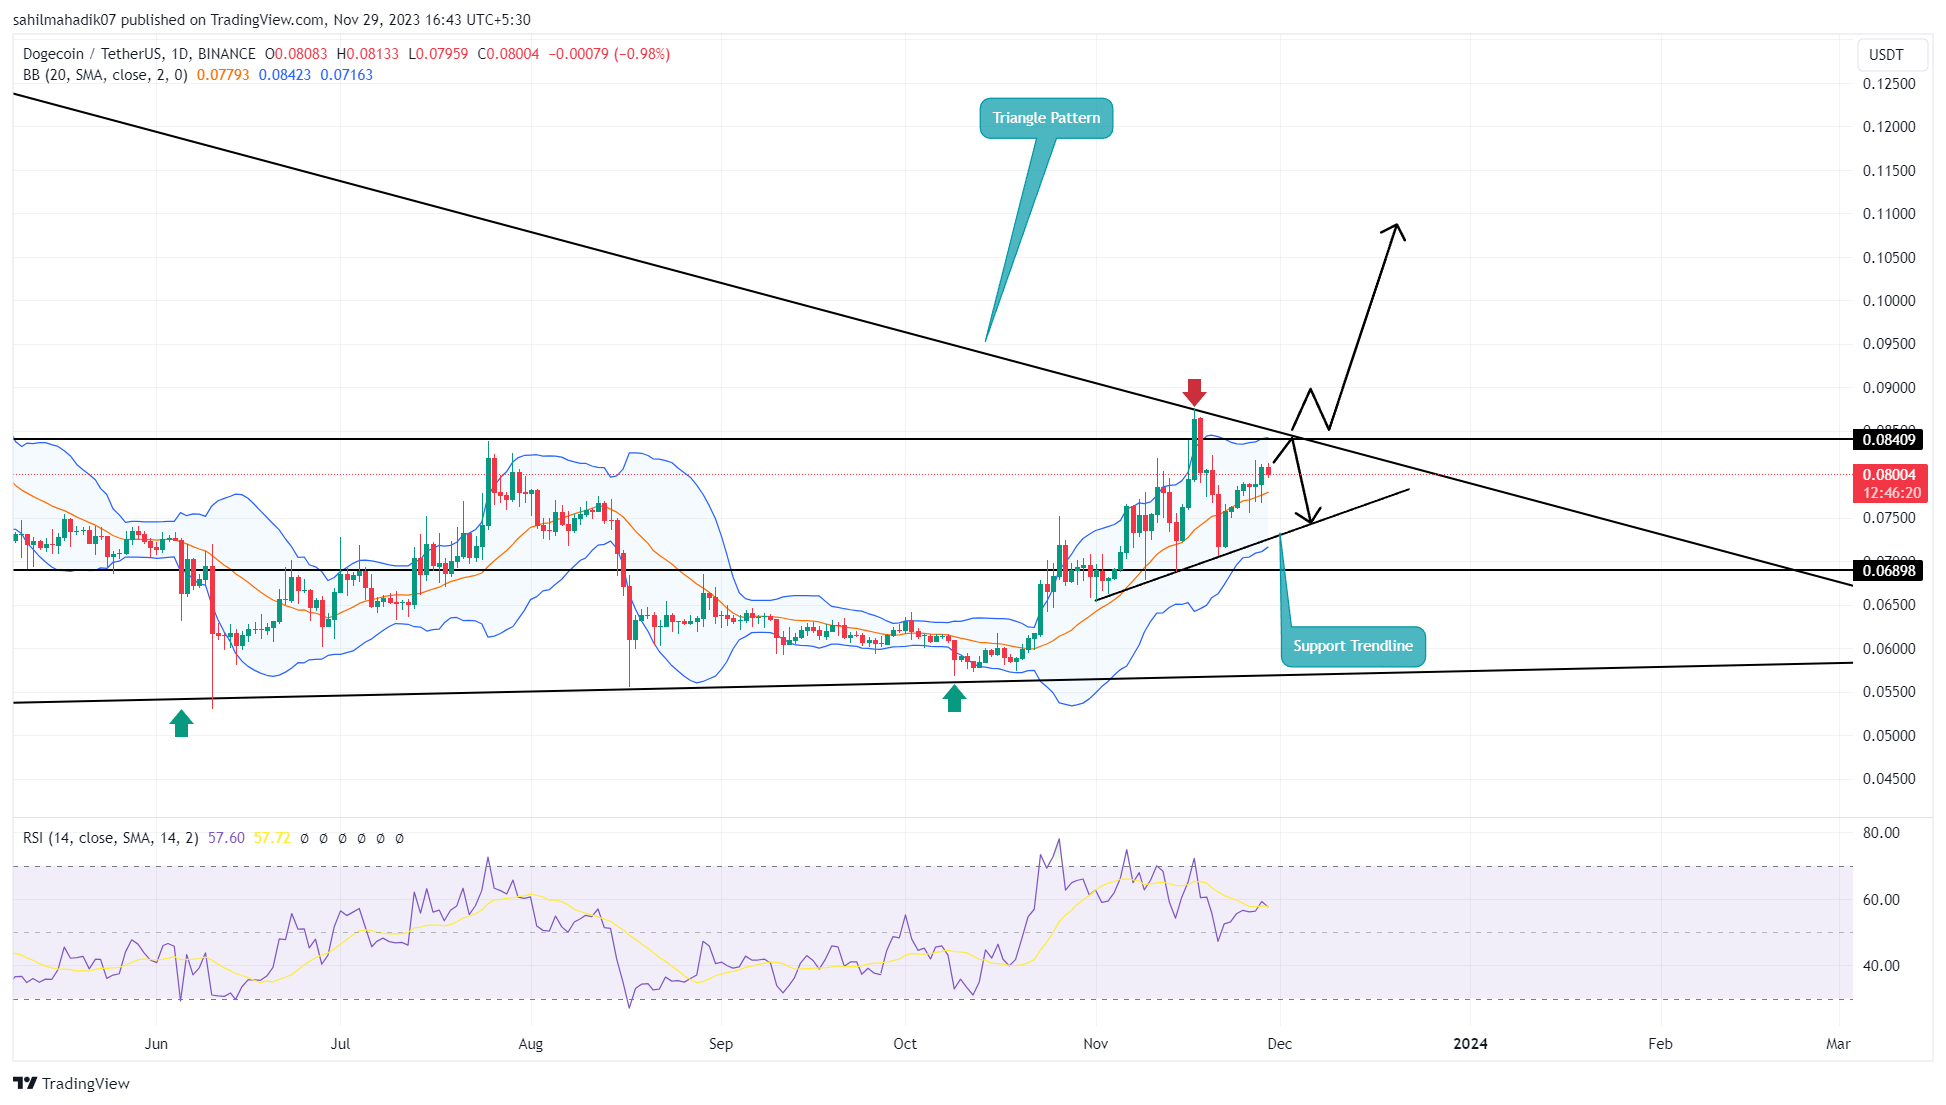
Dogecoin’s (DOGE) price showed high volatility throughout November, influenced by the latest news in the cryptocurrency market regarding a spot Bitcoin ETF and legal issues impacting Binance. Despite noticeable sharp price movements on the daily time-frame chart, these fluctuations didn’t establish a definitive trend, indicating that control wasn’t firmly in the hands of bulls or bears. Amidst this consolidation, Dogecoin is following a triangular formation and a newly formed ascending support trend line, potentially affecting its short-term trend.
Dogecoin Price Analysis
The prominent memecoin Dogecoin has once again captured investors’ attention due to its involvement in a space program. Recent developments surrounding the coin include the deployment of the DOGE-1 Cubesat, part of SpaceX’s Nova-C/IM-1 satellite launch, which has been delayed for about two years. These updates show that the DOGE-1 lunar mission has received regulatory approval to commence on January 12, 2024.

Currently, DOGE’s price is trading at $0.08, gradually rising under the influence of a new support trend line. Despite increased uncertainty in November, the memecoin’s price has found support from this rising trend line multiple times, aiding buyers in maintaining a consistent rally.
As a result, the price is expected to increase by approximately 5% before encountering resistance at around $0.084 on the upper trend line of the long-standing triangular formation. Historical data suggest that retesting this trend line often increases downward momentum and leads to significant corrections, so investors need to be cautious at this point.
Therefore, a confirmed break below the aforementioned support trend line could increase selling pressure, leading to a potential 28% loss from the current price, causing Dogecoin to fall to a lower trend line.
Is DOGE Ready for an Uptrend?
DOGE’s price has been affected by a symmetrical triangle formation for about two years, moving in a sideways trend. If the coin’s price turns from the upper trend line as mentioned, it can be expected to continue moving sideways over the next month. Hence, for a more definitive recovery confirmation, buyers need to see the price break above the triangular formation.
The Relative Strength Index (RSI) slope on the daily time frame indicates that the bullish momentum in the altcoin is waning, and there’s a high possibility of price decline. Similarly, the relatively flat upper boundary of the Bollinger Bands (BB) indicator at $0.084 could serve as an additional barrier against buyers.
- Dogecoin’s price shows continuous volatility.
- Triangle formation could influence the short-term trend.
- Breaks in support trend line may signal downturns.


 BlockchainReporter
 DogeHome
 U_Today
 U_Today
 Optimisus
 Crypto Front News
 Cointribune
 CoinPedia News


