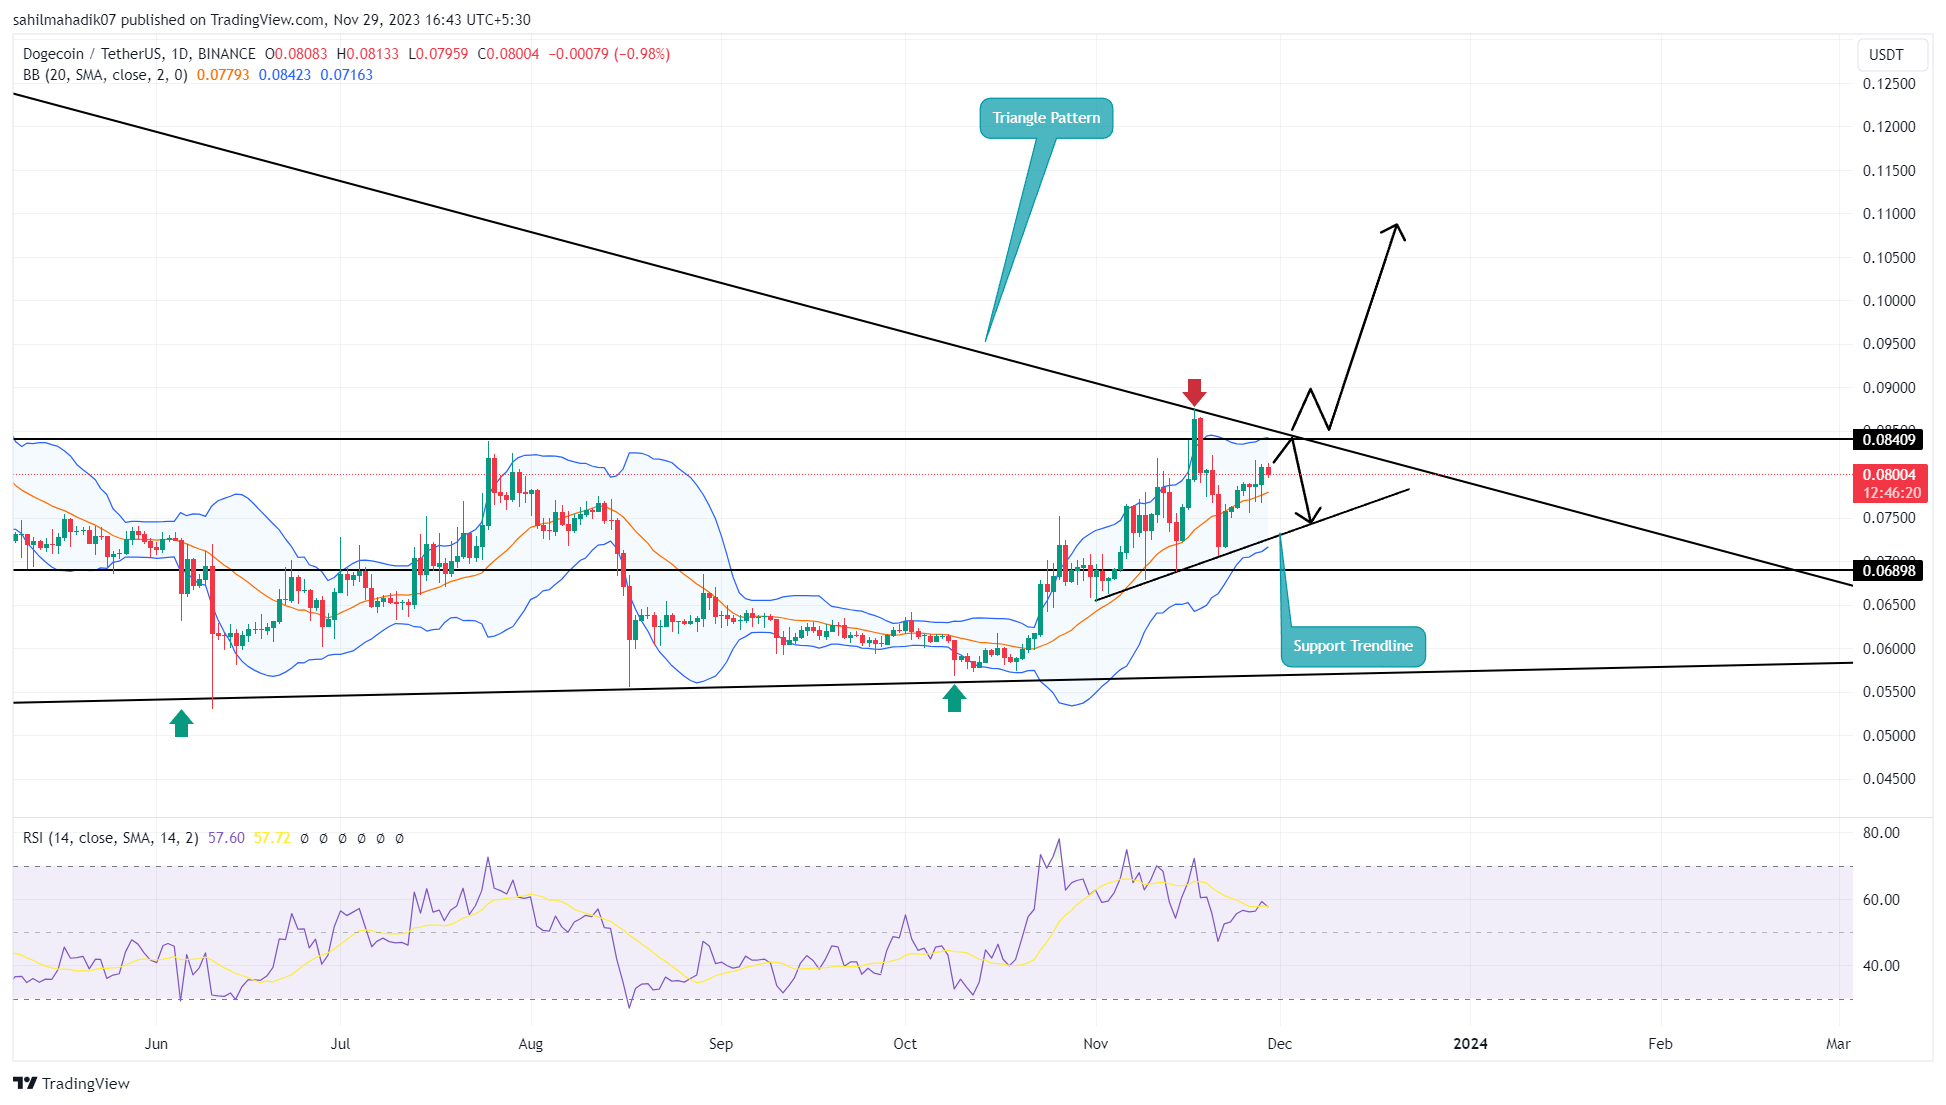
Dogecoin’s (DOGE) price showed high volatility throughout November, influenced by the latest news in the cryptocurrency market regarding a spot Bitcoin ETF and legal issues impacting Binance. Despite noticeable sharp price movements on the daily time-frame chart, these fluctuations didn’t establish a definitive trend, indicating that control wasn’t firmly in the hands of bulls or bears. Amidst this consolidation, Dogecoin is following a triangular formation and a newly formed ascending support trend line, potentially affecting its short-term trend.
ドージコイン(DOGE)の価格は、スポットビットコインETFに関する仮想通貨市場の最新ニュースとバイナンスに影響を与える法的問題の影響を受け、11月を通じて高いボラティリティを示しました。日足の時間枠チャートでは顕著な急激な価格変動があったにもかかわらず、これらの変動は決定的な傾向を確立しておらず、強気派または弱気派の手にしっかりとコントロールがかかっていないことを示しています。この堅調の中で、ドージコインは三角形成と新たに形成された上昇サポートトレンドラインをたどっており、短期トレンドに影響を与える可能性があります。
Dogecoin Price Analysis
ドージコイン価格分析
The prominent memecoin Dogecoin has once again captured investors’ attention due to its involvement in a space program. Recent developments surrounding the coin include the deployment of the DOGE-1 Cubesat, part of SpaceX’s Nova-C/IM-1 satellite launch, which has been delayed for about two years. These updates show that the DOGE-1 lunar mission has received regulatory approval to commence on January 12, 2024.
著名なミームコインであるドージコインは、宇宙計画への関与により再び投資家の注目を集めています。このコインをめぐる最近の動きには、SpaceXのNova-C/IM-1衛星打ち上げの一環であるDOGE-1 Cubesatの配備が含まれるが、これは約2年間延期されている。これらの最新情報は、DOGE-1 月探査ミッションが 2024 年 1 月 12 日に開始する規制当局の承認を得たことを示しています。

Currently, DOGE’s price is trading at $0.08, gradually rising under the influence of a new support trend line. Despite increased uncertainty in November, the memecoin’s price has found support from this rising trend line multiple times, aiding buyers in maintaining a consistent rally.
現在、DOGEの価格は0.08ドルで取引されており、新しいサポートトレンドラインの影響で徐々に上昇しています。 11月に不確実性が高まったにもかかわらず、ミームコインの価格はこの上昇トレンドラインに何度もサポートされており、買い手が一貫した上昇を維持するのに役立っている。
As a result, the price is expected to increase by approximately 5% before encountering resistance at around $0.084 on the upper trend line of the long-standing triangular formation. Historical data suggest that retesting this trend line often increases downward momentum and leads to significant corrections, so investors need to be cautious at this point.
その結果、価格は約5%上昇すると予想され、その後、長期にわたる三角形成の上側トレンドラインにある0.084ドル付近で抵抗線に遭遇すると予想される。過去のデータによれば、このトレンドラインを再テストすると下降の勢いが増し、大幅な調整につながることが多いため、投資家は現時点では注意が必要です。
Therefore, a confirmed break below the aforementioned support trend line could increase selling pressure, leading to a potential 28% loss from the current price, causing Dogecoin to fall to a lower trend line.
したがって、前述のサポートトレンドラインを下回ることが確認された場合、売り圧力が高まり、現在の価格から28%の損失が生じる可能性があり、ドージコインはより低いトレンドラインに下落します。
Is DOGE Ready for an Uptrend?
DOGE は上昇トレンドの準備ができていますか?
DOGE’s price has been affected by a symmetrical triangle formation for about two years, moving in a sideways trend. If the coin’s price turns from the upper trend line as mentioned, it can be expected to continue moving sideways over the next month. Hence, for a more definitive recovery confirmation, buyers need to see the price break above the triangular formation.
DOGEの価格は約2年間、対称的なトライアングル形成の影響を受け、横向きの傾向で推移しています。前述したように、コインの価格が上部のトレンドラインから変化した場合、来月は横向きに動き続けることが予想されます。したがって、より確実な回復を確認するには、買い手は価格が三角形成を上回るかどうかを確認する必要があります。
The Relative Strength Index (RSI) slope on the daily time frame indicates that the bullish momentum in the altcoin is waning, and there’s a high possibility of price decline. Similarly, the relatively flat upper boundary of the Bollinger Bands (BB) indicator at $0.084 could serve as an additional barrier against buyers.
日次時間枠の相対強度指数 (RSI) の傾きは、アルトコインの強気の勢いが弱まり、価格が下落する可能性が高いことを示しています。同様に、ボリンジャーバンド(BB)指標の比較的平坦な0.084ドルの上限は、買い手に対するさらなる障壁として機能する可能性があります。
- Dogecoin’s price shows continuous volatility.
- Triangle formation could influence the short-term trend.
- Breaks in support trend line may signal downturns.
ドージコインの価格は継続的な変動を示しています。
トライアングルの形成は短期的なトレンドに影響を与える可能性があります。
サポートトレンドラインのブレイクは下落のシグナルとなる可能性があります。
続きを読む: https://en.coin-turk.com/ Understanding-dogecoins-volatile-ride-analysis-and-key-levels-to-watch/


 BlockchainReporter
 Optimisus
 DogeHome
 Crypto News Land
 Optimisus
 Crypto News Land
 Crypto News Land
 Optimisus


