You can also read this news on COINTURK NEWS: Dogecoin’s Price Fluctuations: Post-Musk Decline and Technical Analysis
También puede leer esta noticia en COINTURK NEWS: Fluctuaciones de precios de Dogecoin: caída posterior a Musk y análisis técnico
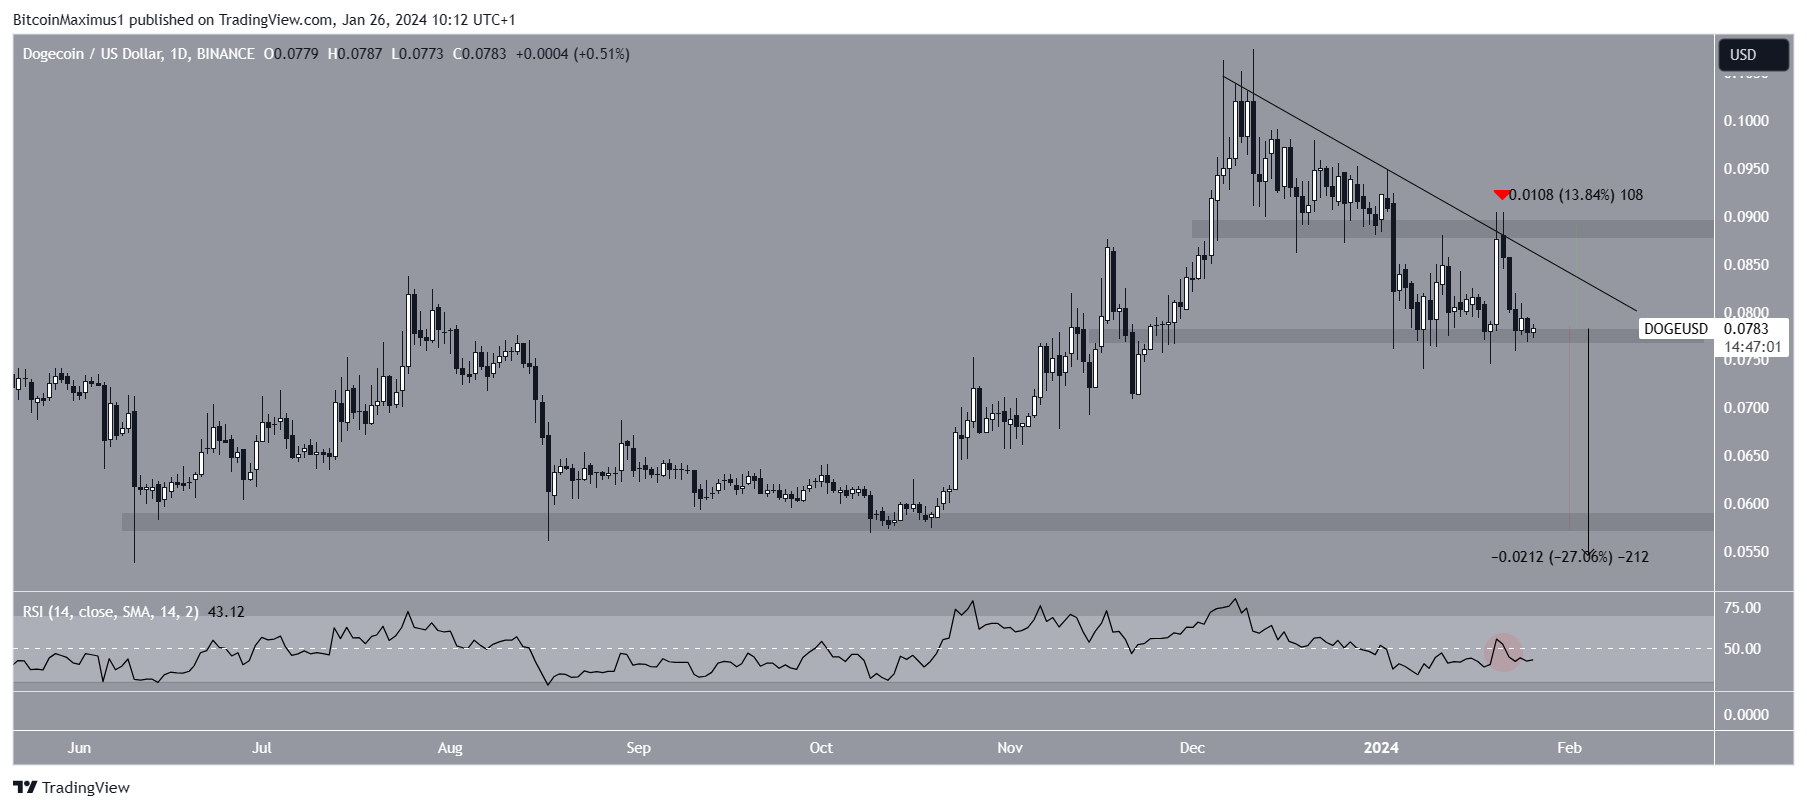
Dogecoin (DOGE) price significantly increased on January 20 but experienced a sharp decline the following day. According to experts, the popular meme token has been trading within the support area of a downward formation for about two months. Will it reverse the trend with a rise, or will losses in Dogecoin continue?
El precio de Dogecoin (DOGE) aumentó significativamente el 20 de enero, pero experimentó una fuerte caída al día siguiente. Según los expertos, el popular token meme se cotiza desde hace aproximadamente dos meses dentro del área de soporte de una formación descendente. ¿Revertirá la tendencia con una subida o continuarán las pérdidas en Dogecoin?
DOGE’s Decline After Elon Musk’s Influence
El declive de DOGE tras la influencia de Elon Musk
In the meme token’s daily time frame technical analysis, the price has been trading in an ascending parallel channel since June 2023. In December, the price exited the channel, rising to $0.108. However, Dogecoin later fell, and a decline within the channel’s boundaries occurred on January 3, 2024.
En el análisis técnico del marco temporal diario del token meme, el precio se ha estado negociando en un canal paralelo ascendente desde junio de 2023. En diciembre, el precio salió del canal y subió a 0,108 dólares. Sin embargo, Dogecoin cayó más tarde y el 3 de enero de 2024 se produjo una caída dentro de los límites del canal.
Since the mentioned period, there have been two unsuccessful attempts to rise. The second rejection in the cryptocurrency occurred shortly after Elon Musk introduced an “X Payments” account on his platform. The daily Relative Strength Index (RSI) is showing a downward trend. Readings above 50 and an upward trend indicate that bulls are still at an advantage, while readings below 50 suggest the opposite.
Desde el período mencionado, ha habido dos intentos fallidos de ascenso. El segundo rechazo en la criptomoneda se produjo poco después de que Elon Musk introdujera una cuenta “X Payments” en su plataforma. El índice de fuerza relativa (RSI) diario muestra una tendencia a la baja. Las lecturas por encima de 50 y una tendencia alcista indican que los alcistas todavía tienen ventaja, mientras que las lecturas por debajo de 50 sugieren lo contrario.

Dogecoin’s Price Trend
Tendencia del precio de Dogecoin
In Dogecoin, the RSI is below 50 and falling, which could be a sign of a bearish trend in both cases. The six-hour time frame, like the daily time frame, is showing a downward trend. This is attributed to DOGE price movement and RSI readings. Dogecoin’s price movement has fallen below a descending resistance trend line since the mentioned peak in December 2023. More recently, the trend line caused a rejection on January 21, 2024.
En Dogecoin, el RSI está por debajo de 50 y está cayendo, lo que podría ser una señal de una tendencia bajista en ambos casos. El período de seis horas, al igual que el período diario, muestra una tendencia a la baja. Esto se atribuye al movimiento de precios de DOGE y a las lecturas del RSI. El movimiento de precios de Dogecoin ha caído por debajo de una línea de tendencia de resistencia descendente desde el pico mencionado en diciembre de 2023. Más recientemente, la línea de tendencia provocó un rechazo el 21 de enero de 2024.
When the resistance trend line is combined with a horizontal area at $0.077, it forms a descending triangle, considered a bearish pattern. The six-hour RSI, being below 50 and falling, could support a price decline. A break covering the entire height of the formation could lead to a 27% drop in Dogecoin, potentially bringing the price to the nearest support at $0.058.
Cuando la línea de tendencia de resistencia se combina con un área horizontal en $0,077, forma un triángulo descendente, considerado un patrón bajista. El RSI de seis horas, si está por debajo de 50 y cae, podría respaldar una caída de precios. Una ruptura que cubra toda la altura de la formación podría provocar una caída del 27% en Dogecoin, lo que podría llevar el precio al soporte más cercano en 0,058$.
The post first appeared on COINTURK NEWS: Dogecoin’s Price Fluctuations: Post-Musk Decline and Technical Analysis
La publicación apareció por primera vez en COINTURK NEWS: Fluctuaciones de precios de Dogecoin: caída posterior a Musk y análisis técnico


 DogeHome
 Coincu
 TheCoinrise Media
 TheCoinrise Media
 Thecoinrepublic.com
 BlockchainReporter
 TheCoinrise
 BlockchainReporter


