You can also read this news on COINTURK NEWS: Dogecoin’s Price Fluctuations: Post-Musk Decline and Technical Analysis
您也可以在 COINTURK NEWS 上閱讀此新聞:狗狗幣的價格波動:後馬斯克的下跌和技術分析
Dogecoin (DOGE) price significantly increased on January 20 but experienced a sharp decline the following day. According to experts, the popular meme token has been trading within the support area of a downward formation for about two months. Will it reverse the trend with a rise, or will losses in Dogecoin continue?
狗狗幣(DOGE)價格在 1 月 20 日大幅上漲,但隔天又大幅下跌。據專家稱,流行的 meme 代幣已經在下行形態的支撐區域內交易了大約兩個月。狗狗幣會扭轉趨勢並上漲,還是會繼續下跌?
DOGE’s Decline After Elon Musk’s Influence
在馬斯克的影響下,DOGE 的衰落
In the meme token’s daily time frame technical analysis, the price has been trading in an ascending parallel channel since June 2023. In December, the price exited the channel, rising to $0.108. However, Dogecoin later fell, and a decline within the channel’s boundaries occurred on January 3, 2024.
在 Meme 代幣的每日時間框架技術分析中,自 2023 年 6 月以來,價格一直在上昇平行通道中交易。12 月,價格退出通道,升至 0.108 美元。然而,狗狗幣隨後下跌,並於 2024 年 1 月 3 日發生了通道邊界內的下跌。
Since the mentioned period, there have been two unsuccessful attempts to rise. The second rejection in the cryptocurrency occurred shortly after Elon Musk introduced an “X Payments” account on his platform. The daily Relative Strength Index (RSI) is showing a downward trend. Readings above 50 and an upward trend indicate that bulls are still at an advantage, while readings below 50 suggest the opposite.
自上述時期以來,曾有過兩次上漲嘗試,但均未成功。加密貨幣的第二次拒絕發生在馬斯克在其平台上推出「X Payments」帳戶後不久。每日相對強弱指數(RSI)呈現下降趨勢。讀數高於 50 且呈上升趨勢表示多頭仍處於優勢,而讀數低於 50 則表示情況相反。

Dogecoin’s Price Trend
狗狗幣的價格趨勢
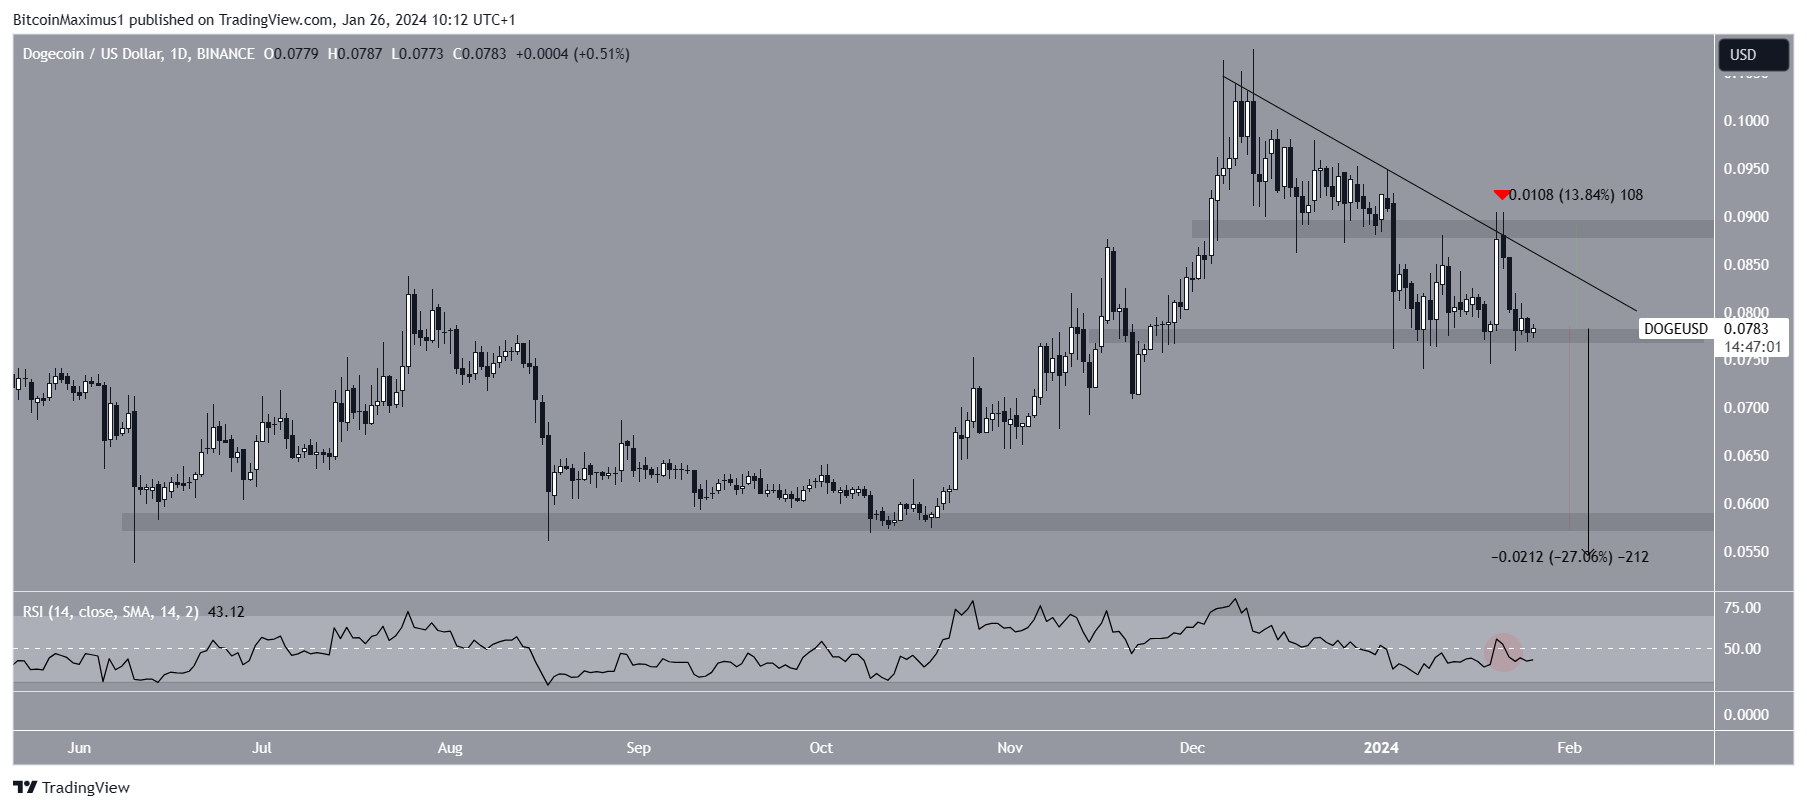
In Dogecoin, the RSI is below 50 and falling, which could be a sign of a bearish trend in both cases. The six-hour time frame, like the daily time frame, is showing a downward trend. This is attributed to DOGE price movement and RSI readings. Dogecoin’s price movement has fallen below a descending resistance trend line since the mentioned peak in December 2023. More recently, the trend line caused a rejection on January 21, 2024.
在狗狗幣中,RSI 低於 50 並且正在下降,這可能是兩種情況下看跌趨勢的跡象。與每日時間框架一樣,六小時時間框架也呈現下降趨勢。這歸因於 DOGE 價格變動和 RSI 讀數。自 2023 年 12 月提到的峰值以來,狗狗幣的價格走勢已跌破下降阻力趨勢線。最近,該趨勢線在 2024 年 1 月 21 日遭到拒絕。
When the resistance trend line is combined with a horizontal area at $0.077, it forms a descending triangle, considered a bearish pattern. The six-hour RSI, being below 50 and falling, could support a price decline. A break covering the entire height of the formation could lead to a 27% drop in Dogecoin, potentially bringing the price to the nearest support at $0.058.
當阻力趨勢線與 0.077 美元的水平區域結合時,它形成一個下降三角形,被視為看跌模式。六小時 RSI 低於 50 並正在下降,可能會支撐價格下跌。突破該形態的整個高度可能會導致狗狗幣下跌 27%,並有可能將價格帶到最近的支撐位 0.058 美元。
The post first appeared on COINTURK NEWS: Dogecoin’s Price Fluctuations: Post-Musk Decline and Technical Analysis
該帖子首次出現在 COINTURK 新聞上:狗狗幣的價格波動:後馬斯克的下跌和技術分析


 Optimisus
 Crypto Front News
 DogeHome
 Cointribune
 CoinPedia News
 CoinoMedia
 CoinEagle.com
 Cointelegraph


