You can also read this news on COINTURK NEWS: Dogecoin’s Price Fluctuations: Post-Musk Decline and Technical Analysis
このニュースは COINTURK NEWS でも読むことができます: ドージコインの価格変動: マスク下落後のテクニカル分析
Dogecoin (DOGE) price significantly increased on January 20 but experienced a sharp decline the following day. According to experts, the popular meme token has been trading within the support area of a downward formation for about two months. Will it reverse the trend with a rise, or will losses in Dogecoin continue?
ドージコイン(DOGE)の価格は1月20日に大幅に上昇しましたが、翌日には急落しました。専門家によると、人気のミームトークンは約2か月間、下降フォーメーションのサポートエリア内で取引されている。上昇して傾向が逆転するのでしょうか、それともドージコインの損失は続くのでしょうか?
DOGE’s Decline After Elon Musk’s Influence
イーロン・マスクの影響でDOGEが衰退
In the meme token’s daily time frame technical analysis, the price has been trading in an ascending parallel channel since June 2023. In December, the price exited the channel, rising to $0.108. However, Dogecoin later fell, and a decline within the channel’s boundaries occurred on January 3, 2024.
ミームトークンの日次時間枠テクニカル分析では、価格は2023年6月以来上昇平行チャネルで取引されています。12月に価格はチャネルから抜け出し、0.108ドルまで上昇しました。しかし、ドージコインはその後下落し、2024 年 1 月 3 日にチャネル境界内で下落が発生しました。
Since the mentioned period, there have been two unsuccessful attempts to rise. The second rejection in the cryptocurrency occurred shortly after Elon Musk introduced an “X Payments” account on his platform. The daily Relative Strength Index (RSI) is showing a downward trend. Readings above 50 and an upward trend indicate that bulls are still at an advantage, while readings below 50 suggest the opposite.
上記の期間以来、上昇の試みが 2 回失敗しました。この仮想通貨の2回目の拒否は、イーロン・マスク氏が自身のプラットフォームに「X Payments」アカウントを導入した直後に発生した。日次相対力指数 (RSI) は低下傾向を示しています。測定値が 50 を超え、上昇傾向にある場合は、強気派が依然として有利であることを示しますが、50 を下回る測定値はその逆を示唆しています。

Dogecoin’s Price Trend
ドージコインの価格動向
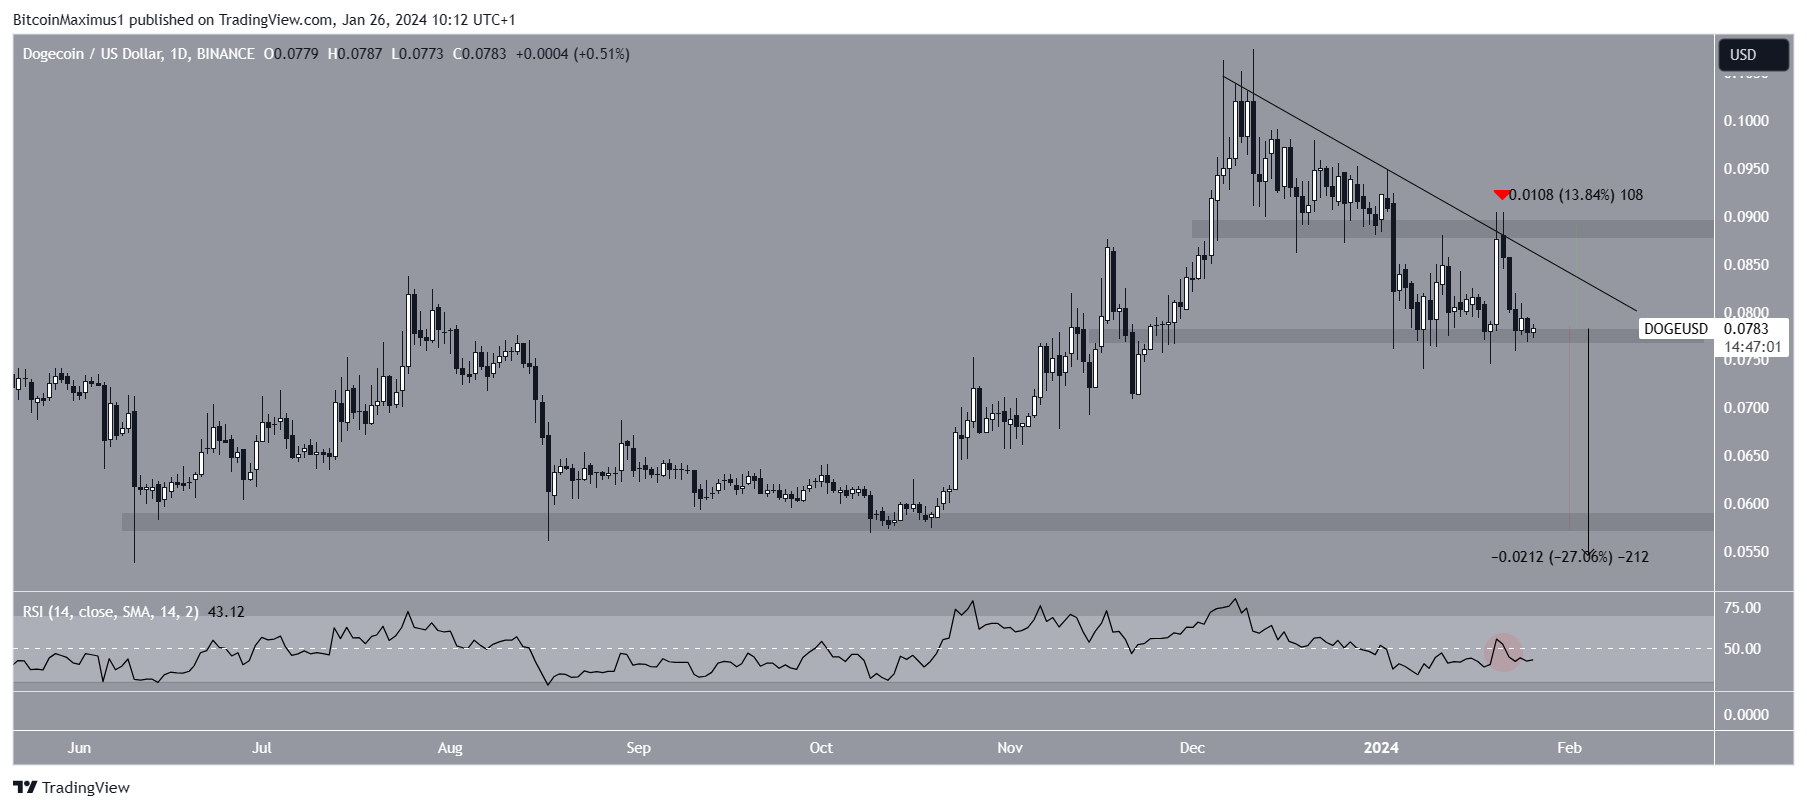
In Dogecoin, the RSI is below 50 and falling, which could be a sign of a bearish trend in both cases. The six-hour time frame, like the daily time frame, is showing a downward trend. This is attributed to DOGE price movement and RSI readings. Dogecoin’s price movement has fallen below a descending resistance trend line since the mentioned peak in December 2023. More recently, the trend line caused a rejection on January 21, 2024.
ドージコインでは、RSI が 50 を下回って下落しており、これはどちらの場合も弱気傾向の兆候である可能性があります。 6時間足も日足と同様に下落傾向を示しています。これはDOGEの価格変動とRSIの測定値に起因すると考えられます。ドージコインの価格変動は、2023 年 12 月の前述のピーク以来、下降抵抗トレンドラインを下回っています。最近では、トレンドラインは 2024 年 1 月 21 日に拒否反応を引き起こしました。
When the resistance trend line is combined with a horizontal area at $0.077, it forms a descending triangle, considered a bearish pattern. The six-hour RSI, being below 50 and falling, could support a price decline. A break covering the entire height of the formation could lead to a 27% drop in Dogecoin, potentially bringing the price to the nearest support at $0.058.
レジスタンストレンドラインが0.077ドルの水平エリアと組み合わされると、下降三角形を形成し、弱気パターンとみなされます。 6時間物のRSIは50を下回り下落しているため、価格下落を支援する可能性がある。フォーメーションの高さ全体をカバーするブレイクは、ドージコインの27%の下落につながる可能性があり、価格は0.058ドルの最も近いサポートに達する可能性があります。
The post first appeared on COINTURK NEWS: Dogecoin’s Price Fluctuations: Post-Musk Decline and Technical Analysis
この投稿は COINTURK NEWS に最初に掲載されました: ドージコインの価格変動: マスク下落後のテクニカル分析


 CFN
CFN U_Today
 Thecoinrepublic.com
 DogeHome
 Optimisus
 Optimisus
 DeFi Planet
 Crypto Daily™
 BlockchainReporter


