Dogecoin started a fresh decline from the $0.0950 resistance against the US Dollar. DOGE could extend its decline unless there is a close above $0.090.
Dogecoin inició una nueva caída desde la resistencia de $ 0,0950 frente al dólar estadounidense. DOGE podría extender su caída a menos que haya un cierre por encima de $0,090.
- DOGE struggled near $0.0950 and started a fresh decline against the US dollar.
- The price is trading below the $0.090 level and the 100 simple moving average (4 hours).
- There is a key bearish trend line forming with resistance near $0.0920 on the 4-hour chart of the DOGE/USD pair (data source from Kraken).
- The price could start a recovery wave if it clears $0.090 and $0.0950.
DOGE luchó cerca de $ 0,0950 y comenzó una nueva caída frente al dólar estadounidense.
El precio se cotiza por debajo del nivel de $ 0,090 y la media móvil simple de 100 (4 horas).
Se está formando una línea de tendencia bajista clave con una resistencia cercana a $ 0,0920 en el gráfico de 4 horas del par DOGE/USD (fuente de datos de Kraken).
El precio podría iniciar una ola de recuperación si supera los USD 0,090 y USD 0,0950.
Dogecoin Price Faces Key Hurdles
El precio de Dogecoin enfrenta obstáculos clave
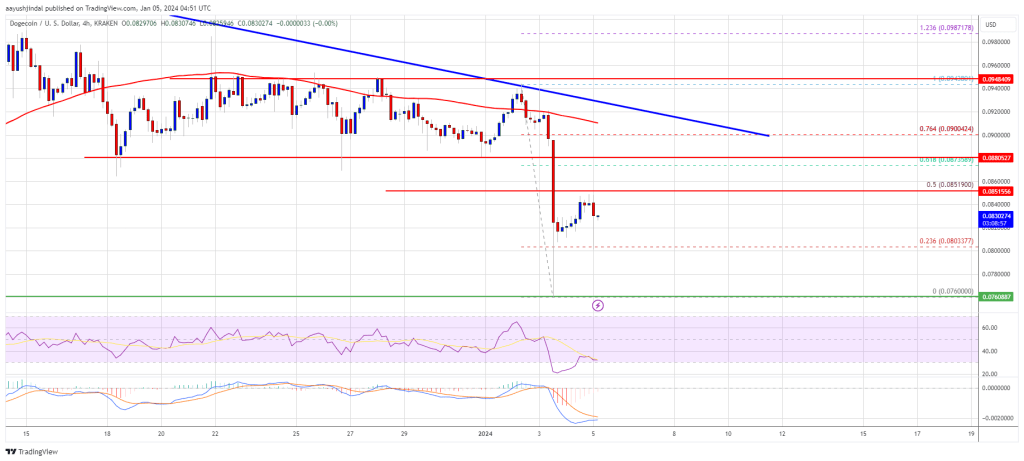
In the past few sessions, Dogecoin price struggled to gain pace above $0.0920. DOGE remained below the $0.095 resistance zone and started a fresh decline, like Bitcoin and Ethereum.
En las últimas sesiones, el precio de Dogecoin tuvo dificultades para ganar ritmo por encima de 0,0920 dólares. DOGE se mantuvo por debajo de la zona de resistencia de $ 0,095 y comenzó una nueva caída, como Bitcoin y Ethereum.
There was a sharp drop below the $0.0900 and $0.0865 support levels. It even tested the $0.0760 zone. A low was formed near $0.0760, and the price is now attempting a recovery wave. There was a move above the $0.080 resistance zone.
Hubo una fuerte caída por debajo de los niveles de soporte de $0,0900 y $0,0865. Incluso probó la zona de $ 0,0760. Se formó un mínimo cerca de USD 0,0760 y el precio ahora está intentando una ola de recuperación. Hubo un movimiento por encima de la zona de resistencia de $ 0,080.
It cleared the 23.6% Fib retracement level of the downward move from the $0.0943 swing high to the $0.0760 low. DOGE is now trading below the $0.090 level and the 100 simple moving average (4 hours). There is also a key bearish trend line forming with resistance near $0.0920 on the 4-hour chart of the DOGE/USD pair.
Superó el nivel de retroceso de Fibonacci del 23,6% del movimiento descendente desde el máximo de $ 0,0943 hasta el mínimo de $ 0,0760. DOGE ahora cotiza por debajo del nivel de $ 0,090 y el promedio móvil simple de 100 (4 horas). También se está formando una línea de tendencia bajista clave con una resistencia cercana a $ 0,0920 en el gráfico de 4 horas del par DOGE/USD.
On the upside, the price is facing resistance near the $0.0875 level. It is close to the 61.8% Fib retracement level of the downward move from the $0.0943 swing high to the $0.0760 low. The next major resistance is near the $0.090 level.
Por el lado positivo, el precio enfrenta una resistencia cercana al nivel de $ 0,0875. Está cerca del nivel de retroceso de Fibonacci del 61,8% del movimiento descendente desde el máximo de $ 0,0943 hasta el mínimo de $ 0,0760. La siguiente gran resistencia está cerca del nivel de 0,090$.
Source: DOGEUSD on TradingView.com
Fuente: DOGEUSD en TradingView.com
A close above the $0.090 resistance might send the price toward the $0.092 resistance. The next major resistance is near $0.095. Any more gains might send the price toward the $0.105 level.
Un cierre por encima de la resistencia de $ 0,090 podría enviar el precio hacia la resistencia de $ 0,092. La siguiente gran resistencia está cerca de 0,095 dólares. Cualquier ganancia adicional podría enviar el precio hacia el nivel de $ 0,105.
More Downsides in DOGE?
¿Más desventajas de DOGE?
If DOGE’s price fails to gain pace above the $0.0875 level, it could start a fresh decline. Initial support on the downside is near the $0.080 level.
Si el precio de DOGE no logra ganar ritmo por encima del nivel de $ 0,0875, podría iniciar una nueva caída. El soporte inicial a la baja está cerca del nivel de $ 0,080.
The next major support is near the $0.0760 level. If there is a downside break below the $0.0760 support, the price could decline further. In the stated case, the price might decline toward the $0.0710 level.
El próximo soporte importante está cerca del nivel de $ 0,0760. Si hay una ruptura a la baja por debajo del soporte de $ 0,0760, el precio podría caer aún más. En el caso indicado, el precio podría caer hacia el nivel de $ 0,0710.
Technical Indicators
Indicadores Técnicos
4 Hours MACD – The MACD for DOGE/USD is now gaining momentum in the bearish zone.
MACD de 4 horas: el MACD para DOGE/USD ahora está ganando impulso en la zona bajista.
4 Hours RSI (Relative Strength Index) – The RSI for DOGE/USD is now below the 50 level.
RSI (índice de fuerza relativa) de 4 horas: el RSI para DOGE/USD ahora está por debajo del nivel 50.
Major Support Levels – $0.080, $0.0760, and $0.0710.
Principales niveles de soporte: $0,080, $0,0760 y $0,0710.
Major Resistance Levels – $0.0875, $0.0920, and $0.0950.
Principales niveles de resistencia: $0,0875, $0,0920 y $0,0950.


 DogeHome
 U.Today
 Thecryptoupdates
 crypto.ro English
 Crypto Intelligence
 DogeHome
 Coincu
 Crypto Intelligence
 BlockchainReporter


